2026-01-07 23:42:00
Article Highlights
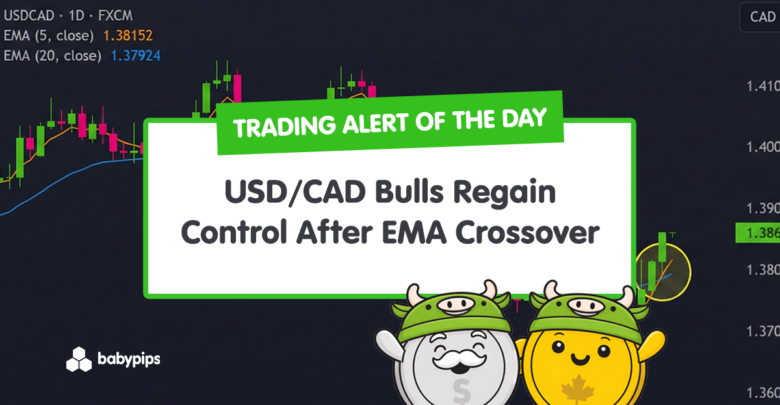
- USD/CAD rebounds from the mid 1.36s and pushes back into the upper 1.38s.
- The 5 period EMA crosses above the 20 period EMA, signaling improving short term momentum.
- Holding above both moving averages would strengthen the case for a developing short term uptrend.
USD/CAD has just registered a fresh bullish crossover between its short‑term and intermediate EMAs, suggesting that near‑term buying pressure is beginning to overtake the prior downtrend.
This signal comes after a choppy but persistent decline from the 1.41 area into the mid‑1.36s, followed by a constructive rebound that has carried the price back above both moving averages.
Traders monitoring for a developing short‑term uptrend may want to watch how the price reacts to nearby resistance around the recent swing highs, as acceptance or rejection there is likely to shape the next directional leg.
What MarketMilk Has Detected
At market close today, MarketMilk detected that the 5-period exponential moving average (EMA) has crossed above the 20-period EMA.
This crossover is occurring as USD/CAD advances from the recent 1.36–1.37 area toward the upper 1.38s, with today’s close at 1.386105.
Price has rebounded from the late-December lows around 1.3670–1.3690 and is now pushing higher after briefly pausing near 1.3770–1.3815.
The crossover suggests that short-term momentum is starting to align with this bounce and may be challenging resistance created by recent swing highs in the 1.3815–1.3860 zone.
What This Signals
Traditionally, a 5 EMA crossing above a 20 EMA is viewed as an early bullish trend signal, indicating that recent price action has strengthened relative to the slightly longer-term average.
In this context, the move suggests that buyers are gaining near-term control after defending the mid‑1.36s and pushing back toward late‑December and early‑January highs.
If the move is sustained and the price holds above the EMAs, it can attract momentum-oriented traders who look for short-term uptrend continuation.
However, this same pattern can also represent a brief relief rally or bull trap within a broader range.
In such choppy conditions, moving average crossovers are prone to whipsaws, where prices briefly move above both EMAs and then quickly slide back, leaving late buyers exposed if the price fails to hold above nearby resistance.
The outcome depends heavily on whether price can stay supported above the EMAs and key recent levels, how it behaves around resistance in the upper 1.38s and beyond, and the broader backdrop for USD and CAD (including rate expectations and oil-related flows).
Context and confirmation are essential before treating this as a durable trend shift rather than another short-lived swing within a wider range.
How It Works
The 5 EMA and 20 EMA are exponential moving averages that place more weight on recent prices compared with simple moving averages.
The 5 EMA tracks very short-term movement, while the 20 EMA smooths out roughly the last month of trading sessions.
A bullish crossover occurs when the faster 5 EMA rises from below to above the slower 20 EMA, signaling that the recent price window has strengthened relative to the medium-term window and indicating a potential shift toward upward momentum.
Important: Because EMAs are derived from past prices, crossovers are inherently lagging signals. They do not predict future direction on their own; instead, they confirm that a move has already been underway long enough to influence the averages. In ranging or sideways markets, ike much of USD/CAD’s recent behavior, these signals can generate multiple false crossovers, so traders often combine them with price structure, higher timeframe trends, and other tools before acting.
What to Look For Before Acting
Do not assume this bullish crossover means USD/CAD is starting a sustained uptrend.
Consider these factors:
- Whether price can hold above both the 5 EMA and 20 EMA on subsequent closes, rather than immediately slipping back below them.
- How USD/CAD reacts around nearby resistance levels, particularly the current area near 1.3860 and any follow-through toward prior highs above 1.40.
- Alignment with the higher timeframe trend on the Weekly chart, to see if this signal supports a broader bullish bias or simply a bounce within a larger range.
- Confirmation from price action, such as higher highs and higher lows forming above the EMAs, instead of a quick return into the prior consolidation zone.
- Volatility conditions: whether the move is occurring with expanding ranges and momentum or within a tight, choppy environment prone to whipsaws.
- Upcoming macro events for USD and CAD, such as Bank of Canada and Federal Reserve communications, inflation data, or employment releases that could reinforce or reverse this technical shift.
- Cross-asset and macro context, including oil prices (which can influence CAD) and overall USD strength or weakness against other majors.
- Broader risk sentiment: risk-on conditions can support CAD, while risk-off flows can favor USD, potentially affecting how this crossover plays out.
Risk Considerations
⚠️ Whipsaw risk in range-bound conditions. USD/CAD has spent significant time oscillating in a broad range, where moving average crossovers often reverse quickly and generate losses for traders who enter too aggressively.
⚠️ Lagging nature of EMAs. By the time a crossover appears, a portion of the move may already be complete, leaving less favorable reward-to-risk if the price is near resistance.
⚠️ False bullish signal near resistance. The crossover is occurring close to recent highs; if sellers defend this zone, the signal could fail even though the indicator appears bullish.
⚠️ Event-driven reversals. Unexpected economic data, central bank remarks, or sharp swings in oil prices can quickly negate the technical setup, especially in FX pairs like USD/CAD.
Potential Next Steps
You may consider adding USD/CAD to your watchlist to see whether the price can maintain closes above both the 5 and 20 EMAs and build a clearer pattern of higher highs and higher lows.
Waiting for confirmation, such as a successful retest of the EMAs as support or a clean break and hold above nearby resistance, can help filter out potential false signals.
For any trading decision, applying disciplined risk management is essential: define position size, stop levels, and invalidation points based on your strategy and tolerance for volatility.
Combining this EMA crossover with higher timeframe analysis, key levels, and relevant macro data can provide a more robust trading strategy than relying on the crossover alone.