
2026-01-07 04:51:00
USD/CAD is seeing a strong start to the year after losing a lot of ground in late December!
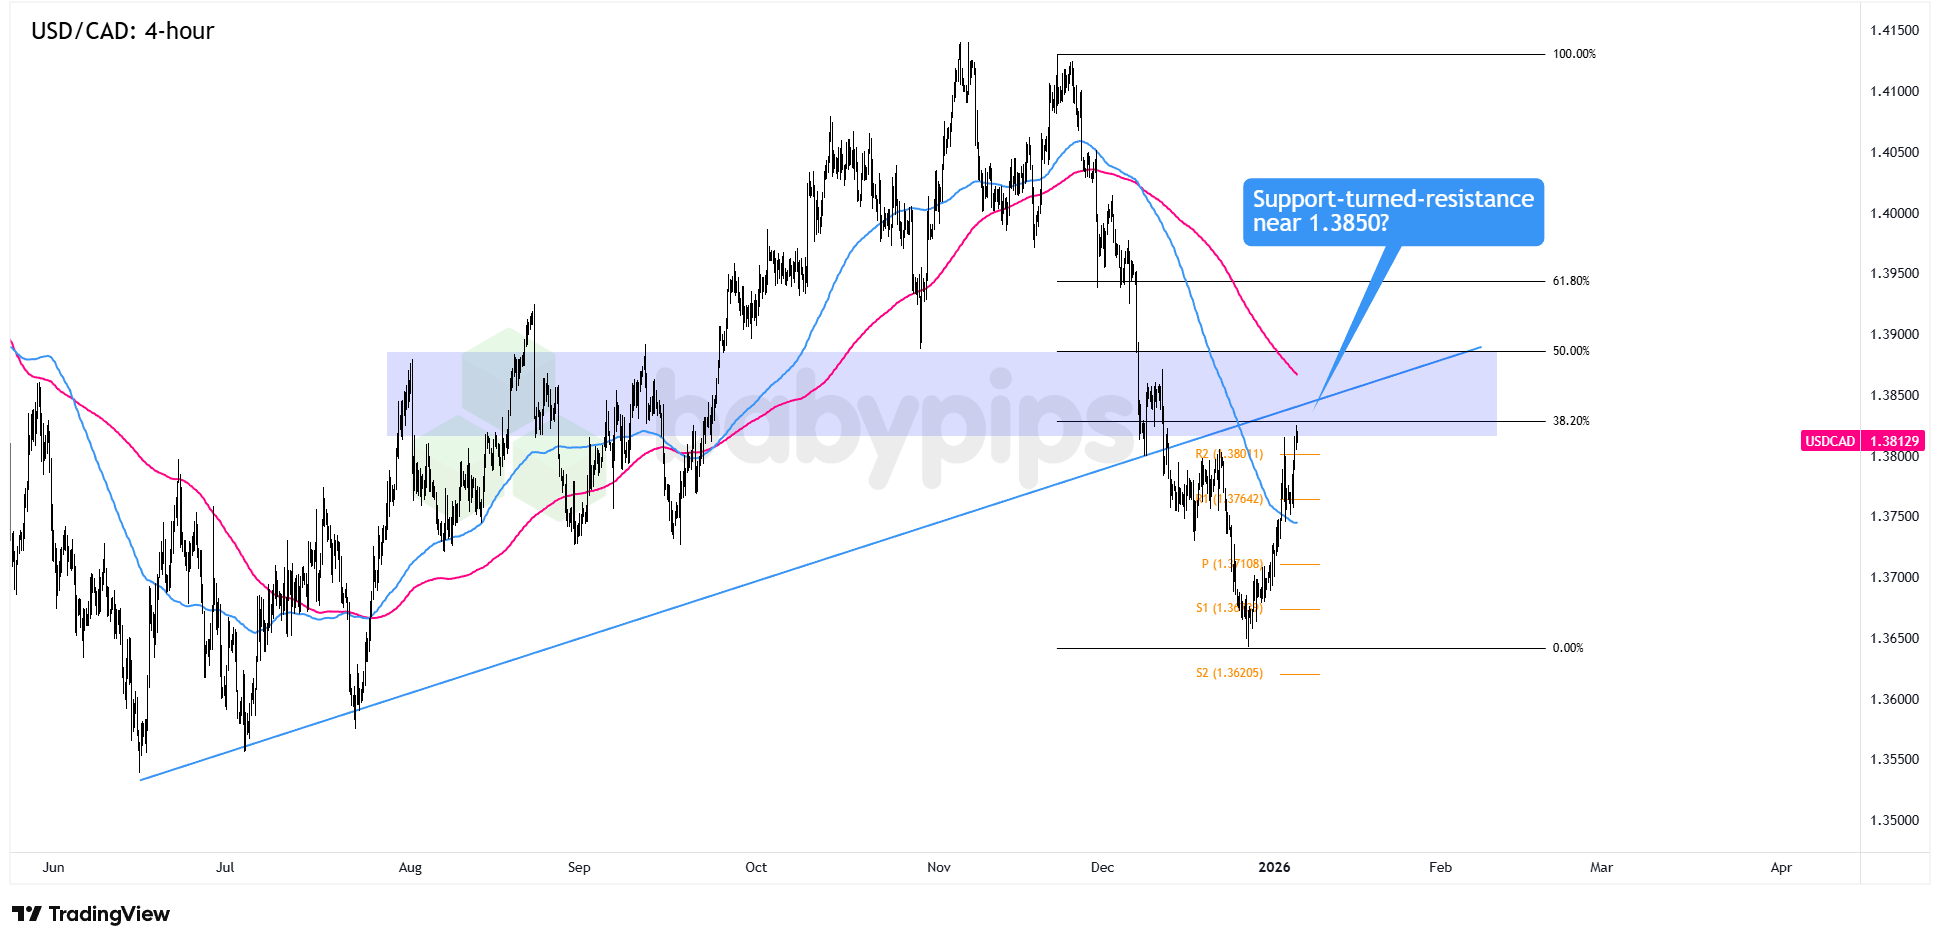
How high can USD/CAD fly before it catches the attention of enough U.S. dollar bears?
We’re taking a closer look at a potential resistance zone that might rain on the bulls’ parade this week.
In case you missed it, the U.S. dollar wrapped up Tuesday higher as traders largely brushed aside weak U.S. leading indicators and leaned into the idea that the U.S. economy is still holding up better than most of its peers.
The Canadian dollar, on the other hand, didn’t get the same love. Falling oil prices have been a headwind, and the noise around potential U.S. military action in strategic territories like Greenland (and maybe Canada?) has added another layer of pressure.
Remember that directional biases and volatility conditions in market price are typically driven by fundamentals. If you haven’t yet done your fundie homework on the U.S. dollar and the Canadian dollar, then it’s time to check out the economic calendar and stay updated on daily fundamental news!
USD/CAD took a beating into the final weeks of December, but the selling finally ran out of steam near 1.3640. Since then, the pair has bounced and is now trading back above the 1.3800 psychological level.
That area is doing a lot of technical work. Current prices line up with former trend line support from the second half of 2025 that has since flipped, and they also sit near the 38.2% Fibonacci retracement of December’s slide. The 200 SMA on the 4-hour chart is close by, too, giving traders plenty to think about.
If USD/CAD runs into resistance here and rolls over, the December down move could easily reassert itself. That would put 1.3700 back in play, with a deeper pullback opening the door to a retest of the 1.3640 lows.
On the upside, if dollar bulls keep control and push through, a sustained move above 1.3900 would change the tone. From there, a run toward the 1.4000 psychological level would not be a stretch at all.
Whichever bias you end up trading, don’t forget to practice proper risk management and stay aware of top-tier catalysts that could influence overall market sentiment.
Disclaimer:
Please be aware that the technical analysis content provided herein is for informational and educational purposes only. It should not be construed as trading advice or a suggestion of any specific directional bias. Technical analysis is just one aspect of a comprehensive trading strategy. The technical setups discussed are intended to highlight potential areas of interest that other traders may be observing. Ultimately, all trading decisions, risk management strategies, and their resulting outcomes are the sole responsibility of each individual trader. Please trade responsibly.


