2026-01-06 00:32:00
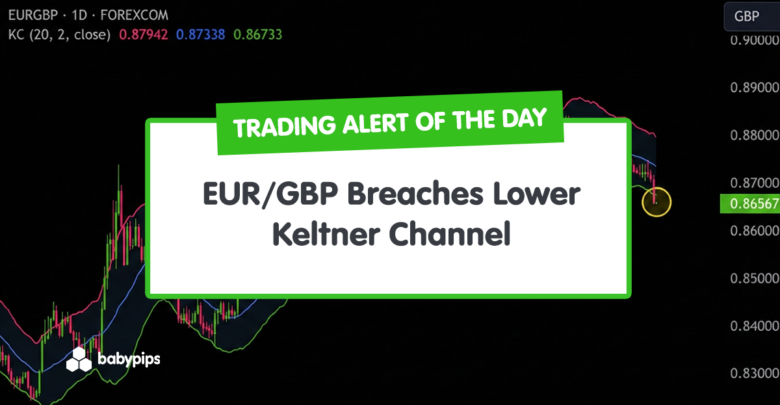
EUR/GBP has just slipped outside the lower band of its Keltner Channel, marking an unusually strong downside move compared with recent volatility.
This type of break can sometimes precede sharp mean-reversion swings.
Traders watching EUR/GBP may see this as an early clue that selling pressure is stretching the pair away from its recent equilibrium.
Welcome to “TA Alert of the Day.” Each day after the market close, MarketMilk scans for popular technical indicator alerts. We use these alerts as the basis for a mini-lesson, breaking down what each alert means, why it matters, and how traders might interpret it. The goal is to help beginner traders not only spot these alerts but also understand the logic behind them and how they can inform trading decisions.
What MarketMilk Has Detected
The latest daily close at 0.865570 pushed EUR/GBP below the current lower Keltner Channel boundary at 0.867123, after previously closing just above it at 0.870700 versus a lower band near 0.868631.
This means price has now dropped outside the range that the recent 20‑day volatility would normally contain.
The breach comes after a gradual softening from the 0.88–0.8830 area seen in November, and places price near the lower end of the multi-month range that has frequently found support around 0.8720–0.8750 and, earlier, near 0.8650–0.8670.
What This Signals
Traditionally, a close below the lower Keltner Channel suggests that EUR/GBP has experienced a volatility-adjusted overshoot to the downside.
This can attract mean-reversion traders looking for a potential bounce back toward the middle line of the channel (currently around 0.8729).
If the move below the band is brief and followed by stabilization or bullish candles, it often marks an area where sellers may be losing momentum and dip-buyers step in.
However, this same pattern can also represent the early phase of a downside volatility expansion, where prices briefly hug or push beyond the lower band as a new or renewed downtrend gains traction.
In that scenario, the breach does not lead to an immediate rebound but instead coincides with persistent lower lows, with prior supports like 0.8720–0.8750 turning into resistance on any retrace.
The current break occurs after a steady easing from the 0.88+ region, so it may also be signaling that bearish pressure is attempting to extend beyond the prior range.
The outcome depends heavily on how price behaves around the lower band in the next few sessions, the broader trend context on higher timeframes, and whether other indicators or price patterns confirm a genuine reversal or a continuation of the downside move.
How It Works
The Keltner Channel is a volatility-based envelope built around an exponential moving average (here, a 20-period middle line at 0.872926).
The upper and lower bands (0.878728 and 0.867123, respectively) are typically set using a multiple of the Average True Range (ATR), which measures recent price volatility.
When price trades near the middle line, it indicates movement close to the recent mean.
When it touches or breaks the outer bands, it suggests price is moving more strongly than usual relative to recent volatility.
Important: A touch or even a close outside a Keltner band is not, by itself, a guaranteed reversal signal. In strong trends, price can walk along the band for extended periods. The reliability of this signal improves when combined with trend analysis, support/resistance levels, and confirming price action rather than treating the band as a hard boundary.
What to Look For Before Acting
Do not assume an immediate bullish reversal. Consider these factors:
- Whether EUR/GBP quickly reclaims the lower band (closes back above ~0.8671), indicating a possible mean-reversion attempt rather than sustained downside expansion.
- How price reacts around recent support zones, particularly the 0.8650–0.8670 area and the prior cluster near 0.8720–0.8750, which have previously attracted buyers.
- Trend direction and strength on higher timeframes such as the Weekly chart to see if this move aligns with a larger downtrend or appears as a countertrend spike.
- Confirmation from other volatility or momentum tools (e.g., ATR behavior, RSI or Stochastic) to assess whether this is oversold momentum within a range or a developing trend move.
- Whether subsequent candles show rejection wicks or bullish reversal formations at or just below the lower band, which can suggest fading selling pressure.
- Relative performance of EUR and GBP across other pairs (e.g., EUR/USD, GBP/USD) to gauge whether this move reflects broad EUR weakness, GBP strength, or pair-specific flows.
- Upcoming eurozone and UK economic data releases, as well as European Central Bank or Bank of England communication, that could reinforce or reverse the latest directional move.
- Overall market risk sentiment: in risk-off environments, flows into or out of EUR and GBP can distort technical signals, so check how equities, bonds, and safe-haven currencies are behaving.
- Volatility conditions: if ATR is rising sharply, breakouts beyond the bands may reflect a new higher-volatility regime where band breaches occur more frequently.
Risk Considerations
⚠️ Trend continuation risk. A break below the lower Keltner Channel can signal the start of a stronger downtrend, where attempts to fade the move are met with continued selling and deeper lows.
⚠️ Volatility expansion risk. If ATR continues to rise, price may trade outside the bands more often, reducing the reliability of band-based reversal expectations and increasing intraday swings.
⚠️ False mean-reversion entries. Entering too early on the assumption of a bounce can lead to multiple stop-outs if EUR/GBP grinds along or below the lower band instead of reverting to the mean.
⚠️ Event-driven reversals. Sudden fundamental shocks (data surprises, policy comments) can override technical signals, causing sharp reversals or accelerations that challenge tight stops around the bands.
Potential Next Steps
You may want to keep EUR/GBP on your watchlist to see whether price quickly returns inside the Keltner Channel or continues to press lower along the band.
Waiting for clear confirmation, such as a close back above the lower band, a rejection pattern from the current area, or confluence with other indicators, can help differentiate between a potential mean-reversion setup and a trend continuation.
Any approach should be paired with defined risk management, including pre-planned stop levels and position sizing appropriate to the current volatility.