2026-01-05 10:44:00
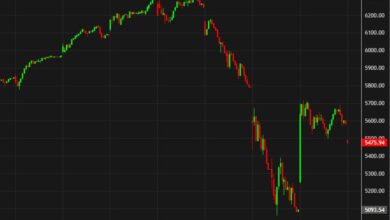
Timeframe: 4-hour chart | investingLive.com | January 2026
Bitcoin technical analysis highlights
-
Bitcoin futures are up about 3.3% from Friday’s close, starting 2026 with bullish momentum.
-
BTC has broken above a multi-touch resistance zone dating back to October 2025.
-
A clean breakout and retest confirms higher acceptance on the 4-hour Bitcoin chart.
-
The Value Area High near 89,600 is holding as key bullish support.
-
As long as Bitcoin holds above the Point of Control near 88,000, the bullish Bitcoin trend remains intact.
Bitcoin futures breakout: why this level matters
This Bitcoin technical analysis focuses on a structurally important resistance level that capped BTC price action for months. On the 4-hour Bitcoin futures chart, that resistance originated from:
-
A pivot high on October 6, 2025
-
A second major test on October 28
-
A near-touch on October 27
-
A closely aligned additional test shortly afterward
Whether traders count this as three or four touches is secondary. What matters is that Bitcoin repeatedly failed at this level in the past, making the eventual breakout technically meaningful.
Last Friday, Bitcoin futures broke decisively above this resistance, signaling a shift in market control from sellers to buyers.
Breakout, retest, and acceptance in Bitcoin price
Bitcoin is pushing higher as PwC’s deeper move into crypto highlights growing institutional confidence, with improving US regulatory clarity lowering adoption barriers for banks, corporates, and payment providers. A breakout alone is not enough. What followed strengthens the bullish case.
-
Friday’s low produced a textbook retest of the previously broken Bitcoin resistance, confirming it as new support.
-
When Bitcoin futures reopened roughly 11–12 hours later, price gapped higher, reinforcing buyer confidence.
At the same time, the Value Area High at approximately 89,600 is being actively defended. In Bitcoin technical analysis terms, this suggests that the market is accepting higher value, rather than rotating back into the prior range.
This area now acts as a clear line in the sand between bulls and bears.
Key Bitcoin support levels to watch
While further pullbacks are always possible, the structure defines where bullish control should remain intact.
-
89,600 (Value Area High): First key support that should continue to hold.
-
88,000 (Point of Control): A critical Bitcoin futures level. Acceptance below this zone would weaken the breakout structure.
-
87,000 (round number): Located just below the Value Area Low, this is a broader bearish threshold.
As long as Bitcoin price stays above 88,000, the breakout thesis remains valid.
Bitcoin pitchfork structure and tactical pullbacks
A rising pitchfork channel is currently guiding BTC price action. For trend continuation, bulls will want to see Bitcoin remain within this channel.
A retracement toward ~90,650 would still be constructive rather than bearish. This level aligns with:
This confluence creates a technically logical area where speculative Bitcoin longs may expect additional buyers to step in.
What would turn Bitcoin bearish
For now, this remains a secondary scenario, but it is clearly defined.
If Bitcoin futures were to print two consecutive 4-hour candles closing decisively lower, especially with acceptance back below value, that would indicate bearish re-engagement. Until then, Bitcoin bulls remain firmly in control of the medium-term structure.
Bitcoin outlook into early 2026
Bitcoin and the broader crypto market are starting 2026 on a bullish technical footing. If current support levels continue to hold, market participants and media narratives are likely to shift attention back toward the 100,000 round number, a major psychological reference in Bitcoin price analysis.
As always, this is scenario-based Bitcoin technical analysis, not a prediction. Trade at your own risk, manage exposure carefully, and return to investingLive.com later this week for updated Bitcoin levels and follow-up perspectives as price action evolves
By The Order Flow Desk | investinglive.com
Date: Monday, January 5, 2026
Bitcoin futures kicked off the week with a decisive gap higher, creating a stir among retail and institutional traders alike. While the headline price action is undeniably bullish, the real story lies “under the hood” in the order flow.
At InvestingLive, our proprietary volumetric systems have been tracking a significant shift in market participant behavior since late last week. We are seeing classic signs of institutional absorption—where “Smart Money” passively buys into weakness, setting the stage for the kind of squeezes we are witnessing now.
Here is what our advanced flow analysis is signaling for the sessions ahead.
The Setup at Bitcoin Futures at the End of Last Week: Anatomy of a Bear Trap
To understand today’s rally, we have to look at how last week ended. On Friday afternoon, Bitcoin appeared heavy, drifting below key average prices. Sentiment was bearish, and sellers were aggressive.
However, our systems flagged a critical anomaly late in the session. As price poked new lows, we detected a massive spike in aggressive selling that failed to push the price down. In institutional analysis, we call this a “Passive Reversal.”
Essentially, large limit buyers stepped in and absorbed every sell order the market threw at them. This created a “Bear Trap”—shorts were caught at the lows with nowhere to go but out. That trapped liquidity became the fuel for today’s gap up.
The “Inventory Squeeze” in Bitcoin Today So Far
Today’s open saw Bitcoin gap well above Friday’s value area (above the 90,670 level). What is fascinating is the quality of the move.
During the initial rally, our flow trackers showed that aggressive buying was actually quite low. In fact, for several hours, the net order flow was negative even as prices rose. This is a classic “Inventory Squeeze.” It suggests that retail traders or algorithms were trying to fade the gap (shorting into the rally), but institutional players were simply holding their bids higher, forcing price up without needing to aggressively chase it.
The market has been climbing a “Wall of Worry”—and that is often the healthiest way to sustain a trend.
The “Guardian” at the VWAP for Bitcoin Futures Today
After hitting a session high near 93,970, we saw a healthy retracement. This is where the rubber meets the road. In a weak market, retracements turn into reversals. In a strong market, they are bought.
Here is what our volume scanners just detected:
-
The Flush: We saw a sharp dip back toward the session’s average price (VWAP) around the 92,800–92,900 zone.
-
The Defense: Precisely at the lows of this dip (specifically around the 03:23 mark), our indicators lit up. We didn’t just see “buying”—we saw protective aggression. A specific class of buyer stepped in to defend the floor, absorbing selling pressure instantly.
We often refer to this signature as “The Guardian.” It confirms that major players are not just watching the market; they are actively defending their entry prices.
The Road Ahead for Bitcoin Today and This Week: Battle Lines Drawn
While the trend remains bullish, the market is currently digesting the recent volatility. We are monitoring a “Battle Zone” that has developed in the last few hours.
While “The Guardian” buyers are protecting the 92,800 floor, a pocket of supply has re-emerged near 93,400–93,500. This is the key level to watch.
-
Bullish Scenario: If price can reclaim 93,500, the sellers who entered recently will be trapped, likely triggering another rapid squeeze toward the daily highs.
-
Cautionary Note: The trend remains your friend as long as the price holds above the average weighted price (approx. 92,900). A sustained break below this “Guardian” level would invalidate the immediate bullish thesis.
The Bottom Line for Bitcoin Traders and Investors: The underlying structure of the market is stronger than the price chart alone suggests. The absorption we saw on Friday and the defense we are seeing today point to continued institutional accumulation. Ignore the noise, watch the 92,800 defense line, and look for the next squeeze above 93,500.
Also from today, you’re welcome to check out
EURUSD:
In the 1st technical analysis of 2026, EURUSD remains under pressure after rejecting the 1.18 resistance, with bears in control as price trades below the anchored VWAP and key downside levels stay in focus.
Gold:
In the 1st technical analysis of 2026, gold starts the year on a bullish footing after buyers defended the Value Area Low, reclaimed value, and kept upside targets near 4,450–4,489 firmly in play
Disclaimer: This analysis is for informational purposes only and does not constitute financial advice. Trading futures involves substantial risk.