USDINR Technical Analysis: Trump threatens more tariffs, key 90.40 level in focus
2026-01-05 10:36:00
KEY POINTS:
- US dollar recovers the Christmas week losses
- The market is still betting on at least two rate cuts in 2026 from the Fed
- On Friday, we have the US NFP report
- Indian Rupee erased half of its gains since the RBI’s intervention
- Trump threatens more tariffs on India if they don’t help with Russian oil issue
- Key 90.40 level in focus as a break above it should open the door for new record highs
FUNDAMENTAL
OVERVIEW
USD:
The
greenback weakened across the board during the Christmas week but eventually
recovered most of the losses. The price action during Christmas holidays is
generally just noise, so it’s not surprising that most markets returned to
original levels.
In terms
of macro, nothing has changed in these two weeks. The latest NFP and CPI reports
came both on the softer side and the market is still pricing 63 bps of easing
by year-end. The data in December was taken with a pinch of salt given the
shutdown related issues, but the next releases will give us a clearer picture.
The market
expects the Fed to cut in March at the earliest, so we will need very soft data
this month to force them to act sooner. Nonetheless, if the data continues to
come in on the softer side, the market will likely increase the total easing
for 2026 and that should weigh on the US dollar.
On the
other hand, if the data shows strength, traders will likely pare back their
rate cut bets and that will likely offer the greenback some support.
INR:
The Indian Rupee enjoyed
a relief rally after the RBI intervened on December 17. Unfortunately, the big
picture trend remains skewed to the downside for the Rupee, and we are already
seeing the gains evaporating with the USD/INR pair approaching the key 90.40
level.
Moreover, Trump threatened
more tariffs on India today “if they don’t help on Russian oil issue”.
Trump wants India to stop importing Russian oil and force Moscow to accept a
peace deal with Ukraine.
USDINR TECHNICAL
ANALYSIS – DAILY TIMEFRAME
USDINR – daily
On the daily
chart, we can see that USDINR fell all the way back to the lower bound of the
rising channel following the RBI’s intervention on December 17. The dip-buyers
started to pile in around the bottom trendline and after breaking above the key
89.70 level, increased the bullish bets into the 90.40 resistance. A break
above the 90.40 level should open the door for a rally into a new record high.
USDINR TECHNICAL
ANALYSIS – 4 HOUR TIMEFRAME
USDINR – 4 hour
On the 4 hour
chart, we can see that we have a strong resistance around the 90.40 level. The
sellers will likely step in there with a defined risk above the resistance to
position for a drop into the 89.60 level. The buyers, on the other hand, will
look for a break higher to increase the bullish bets into a new all-time high.
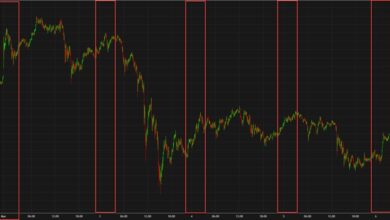
USDINR TECHNICAL
ANALYSIS – 1 HOUR TIMEFRAME
USDINR – 1 hour
On the 1 hour
chart, there’s not much else we can add here as the sellers will likely step in
around the resistance to target new lows, while the buyers will look for a
break higher to position for a rally into a new record high.
UPCOMING CATALYSTS
Today we get the US ISM Manufacturing PMI. On Wednesday, we have the US ADP,
the US ISM Services PMI and the US Job Openings data. On Thursday, we get the
latest US Jobless Claims figures. On Friday, we conclude the week with the US
NFP report.