2025-12-31 23:39:00
Article Highlights
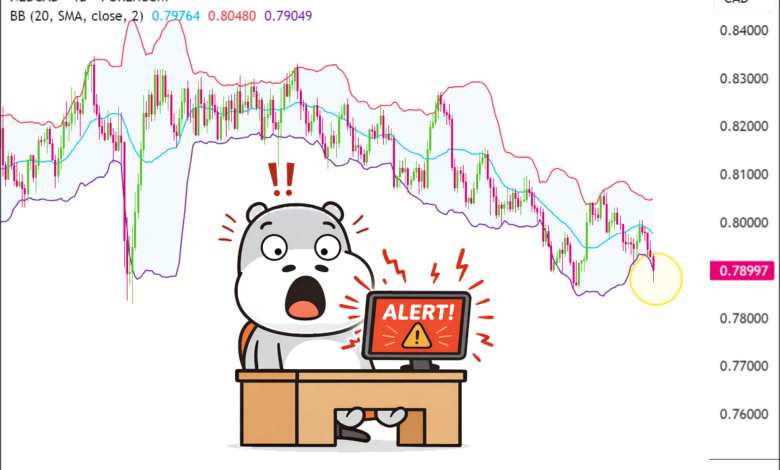
- NZD/CAD decisively breaks below its lower Bollinger Band, ending weeks of contained price action.
- A slip under the 0.7910–0.7920 support zone puts recent dip-buyers firmly on the defensive.
- The mid-band near 0.7973 now defines the upside ceiling if a bounce attempts to form.
The latest move in NZD/CAD has pushed the price outside its recent volatility band, signaling an unusual extension to the downside.
This type of breach often draws attention from traders looking for either exhaustion in the current move or acceleration in a developing trend.
How price behaves around this level may set the tone for the next leg in this cross.
Welcome to “TA Alert of the Day.” Each day after the market close, MarketMilk scans for popular technical indicator alerts. We use these alerts as the basis for a mini-lesson, breaking down what each alert means, why it matters, and how traders might interpret it. The goal is to help beginner traders not only spot these alerts but also understand the logic behind them and how they can inform trading decisions.
What MarketMilk Has Detected
NZD/CAD closed today below its lower Bollinger Band, with the latest close at 0.789435 versus the current lower band near 0.790875.
This marks a decisive break below the volatility boundary after trading mostly within the band range for the last several weeks.
The move comes after a gradual drift lower from the mid-0.80s area seen earlier in October, with recent closes clustered around 0.7930–0.7990 before this downside extension.
This breach occurs just under prior short-term support around 0.7910–0.7920 (late November and late December swing areas), suggesting that previous buyers at that zone are being tested.
The middle Bollinger line (around 0.7973) now sits as a nearby reference resistance on any potential rebound from these levels.
What This Signals
Traditionally, when the price closes below the lower Bollinger Band, it can indicate an oversold volatility extension that often precedes a pause or a mean-reversion attempt back toward the middle band.
For NZD/CAD, this development suggests that the recent selling pressure has stretched the price beyond its typical range, which can attract contrarian traders watching for a bounce toward 0.7950–0.8000 if downside momentum fades.
However, this same pattern can also represent the early stages of a downside breakout (breakdown) where prices briefly ride the lower band as a guide in a stronger downtrend.
If NZD/CAD continues to close near or below the lower band and fails to quickly reclaim the 0.7910–0.7930 area, the breach may instead be signaling a continuation of the broader softening from the 0.80–0.81 region seen in October and early December.
The outcome depends heavily on:
- How price behaves in the next few sessions relative to the lower and middle Bollinger Bands.
- The reaction around nearby horizontal levels (0.7870–0.7920).
- And how broader risk sentiment is affecting NZD and CAD individually.
Context and confirmation are essential before treating this as a reliable bullish opportunity.
How It Works
Bollinger Bands are a volatility-based indicator built around a moving average (here, a 20-period middle band) with upper and lower bands set typically at two standard deviations above and below that average.
When price touches or moves outside the bands, it signals that the move is statistically unusual relative to recent volatility, but not necessarily that a reversal is imminent.
A close below the lower band, as seen now in NZD/CAD, highlights a short-term volatility spike to the downside.
Important: Bollinger Bands measure volatility, not direction. A band breach can precede either a sharp reversal back inside the range or an acceleration in the current trend. Reliability improves when band signals align with other tools such as support/resistance, trend analysis, and higher-timeframe structure.
What to Look For Before Acting
Do not assume a straightforward bullish reversal from this lower band breach.
Consider these factors:
- Whether NZD/CAD quickly reclaims and closes back inside the lower band, suggesting a possible exhaustion spike rather than a new leg down.
- Price action around the 0.7910–0.7930 zone, which has acted as short-term support and now may behave as resistance if selling pressure persists.
- Reaction near the middle Bollinger Band (~0.7970–0.7980) if price bounces; failure there can indicate that the broader downward bias remains intact.
- The broader trend on the Daily and Weekly charts: is this breach happening within a well-established downtrend, or after a range where mean reversion is more common?
- Any clustering of candles with long lower wicks or reversal patterns (e.g., hammers) near 0.7870–0.7900, which can support the idea of selling exhaustion.
- Volatility behavior: do the bands continue to widen (trend expansion) or start to stabilize/narrow (potential consolidation and mean reversion)?
- Key macro and fundamental drivers for NZD and CAD, including upcoming RBNZ and BoC communications, commodity price moves (notably oil for CAD), and major risk sentiment data releases.
- Cross-asset and risk sentiment context: whether markets are in risk-on mode (often supportive of NZD relative to CAD) or risk-off (which can favor CAD via oil and defensive flows).
- Confluence with other indicators, such as momentum oscillators (RSI, Stochastics), showing oversold momentum on higher timeframes, which can strengthen the mean-reversion case if aligned.
Risk Considerations
⚠️ Risk of trend continuation instead of reversal. A close below the lower band can mean the start of a stronger downtrend, especially if the price rides the band lower, leading to deeper drawdowns for premature contrarian entries.
⚠️ Whipsaw and false signals in choppy markets. In range-bound or sideways conditions, Bollinger Band touches and breaches can quickly reverse, triggering frequent stop-outs if entries and exits are not clearly defined.
⚠️ Ignoring higher timeframe structure. Trading a short-term band breach against a dominant Weekly downtrend in NZD/CAD can increase risk if the larger trend overwhelms the local oversold signal.
⚠️ Event-driven volatility. Unexpected data releases, central bank comments, or sharp moves in oil prices can override technical signals and extend volatility beyond what recent band behavior implies.
Potential Next Steps
You may choose to keep NZD/CAD on your watchlist, monitoring whether the price quickly returns inside the bands and how it reacts around 0.7910–0.7930 and the middle band near 0.7970–0.7980.
Waiting for additional confirmation, such as a supportive candlestick structure, momentum stabilization, or alignment with the prevailing trend, can help distinguish a genuine mean-reversion setup from a developing downside trend continuation.
Any strategy built around this signal should incorporate clear invalidation levels (for example, below recent lows around 0.7870) and position sizing that assumes further volatility expansion is possible.
Combining Bollinger Band analysis with broader NZD and CAD fundamentals, plus overall risk sentiment, can improve decision quality around this type of volatility-based alert.