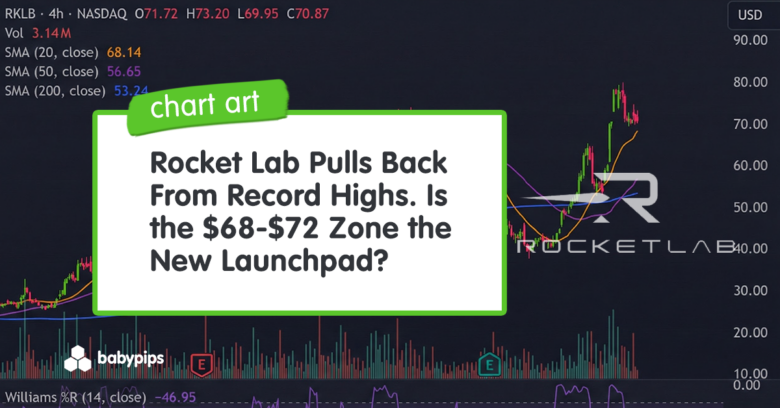
Chart Art: Rocket Lab Pulls Back From Record Highs. Is the $68-$72 Zone the New Launchpad?
2025-12-31 15:59:00
Article Highlights
- Parabolic Rally Meets Consolidation: Up 111% YTD from $30s to $80 peak in December. Now pulled back 11%. Williams %R shows cooling from overbought extremes.
- Critical Support Zone in Focus: $68-$72 area anchored by 20 SMA at $68.14. Break below targets 50 SMA at $56. Hold above keeps bull structure intact for retest of $80.
- Strong Moving Average Structure Despite Pullback: Price remains 33% above 200 SMA confirming uptrend. Pullback occurring on declining volume suggests profit-taking, not distribution. Multiple rejections at $72-$75 resistance create short-term ceiling.
Rocket Lab (RKLB) is trading around $70-71, consolidating below its mid-December record high near $80 after a parabolic rally driven by the company’s largest contract win to date and a perfect 2025 launch record.
While most people prepare to watch fireworks launch into the sky at midnight tonight, Rocket Lab shareholders are celebrating something even more explosive. 💥
The small-satellite launch and space systems provider has delivered a stunning 111% gain year-to-date, surging from the $30s to briefly touch $80 on the back of an $816 million Space Development Agency (SDA) contract and flawless operational execution.
However, Williams %R signals the stock has cooled from extreme overbought conditions, creating an inflection point as momentum traders and long-term investors debate whether the pullback represents healthy consolidation or the beginning of a deeper correction.
So now the question is:
Can Rocket Lab defend the $68-$72 support zone and resume its climb toward new highs, or will profit-taking accelerate into a test of the $65 level or even the 50-day SMA at $56.65?
RKLB (Rocket Lab): 4-Hour Chart
Trend and Market Structure
The 4-hour chart reveals a stock that experienced a spectacular multi-month rally followed by a sharp spike and pullback pattern, with Rocket Lab now testing whether it can consolidate gains above the 20-day SMA or succumb to deeper profit-taking.
Rocket Lab’s 2025 performance ranks among the year’s most impressive growth stock stories, with shares surging over 111% from spring lows around $30 to the December peak near $80.
This extraordinary rally reflects a shift in how the market values the company, from niche small-satellite launcher to credible national security aerospace contractor and emerging SpaceX alternative.
The December Catalyst Surge
The explosive move from $65 to $80 in mid-December was driven by a convergence of catalysts that validated Rocket Lab’s “space economy compounder” thesis:
- $816M Space Development Agency Contract (December 19): Rocket Lab won its largest contract ever to design and manufacture 18 satellites for the U.S. Space Force’s Tracking Layer Tranche 3 (TRKT3) missile-warning and defense program. This landmark deal represents validation as a credible satellite manufacturer competing with legacy aerospace primes.
- Perfect 2025 Launch Record: 21 successful Electron rocket launches with 100% mission success rate (versus 16 launches in 2024 and 10 in 2023), demonstrating operational excellence and scaling capacity.
- Neutron Milestone: The “Hungry Hippo” reusable fairing for Rocket Lab’s next-generation Neutron rocket completed qualification testing, passing 275,000 pounds of force simulation and rapid open/close operations. Neutron represents the company’s transition from small-lift to medium-lift capability (up to 13,000 kg payload).
- Trump Space Policy Executive Order (December 18): White House order emphasizing space security, missile defense, and 2028 moon landing goals created tailwinds for defense-focused space contractors.
- Analyst Upgrades: Needham raised price target to $90 (from $63), Stifel to $85, reflecting optimism about the SDA contract and Neutron potential.
- Strong Financials: Q3 2025 revenue of $155M (up 48% YoY) with Q4 guidance of $170-$180M, and over $1 billion in liquidity to fund Neutron development.
The Post-Spike Pullback
After touching approximately $80, Rocket Lab has corrected roughly 11% to current levels around $71.
This pullback on lighter volume suggests profit-taking by momentum traders who rode the parabolic move rather than fundamental deterioration.
The stock remains well above all major moving averages, confirming the long-term uptrend structure stays intact.
Moving Average Structure
Price currently trades just above the 20 SMA at $68.14, which has provided dynamic support during the recent consolidation.
This moving average represents the first line of defense for the near-term uptrend.
A HOLD above this level would keep bullish momentum intact and suggest the pullback is merely a healthy digestion of gains.
The 50 SMA sits at $56.65, approximately 20% below the current price. This moving average has not been tested since the November breakout phase and would represent a more significant retracement if reached.
However, such a pullback would likely attract long-term buyers given the strengthened fundamental backdrop.
Most importantly, the 200 SMA at $53.24 confirms Rocket Lab’s transition to a sustained uptrend.
The stock trades 33% above this long-term trend indicator, showing healthy momentum without the extreme overextension seen in some parabolic moves that end badly.
Volume Analysis
Recent volume during the December surge shows heavy participation, confirming institutional involvement rather than purely retail-driven momentum.
But the subsequent pullback has occurred on diminishing volume, a constructive sign suggesting selling pressure is not urgent or panicked.
Momentum and Williams %R Analysis
The Williams %R indicator currently reads -46.95, sitting in neutral territory after cooling from extremely overbought levels, creating a technical setup that could resolve in multiple ways.
Williams %R Structure
Williams %R operates on a scale from 0 (extremely overbought) to -100 (extremely oversold), making the current -46.95 reading relatively neutral.
Readings above -20 indicate overbought conditions, while readings below -80 signal oversold territory.
The current -46.95 level suggests Rocket Lab has normalized from the extreme momentum that drove the spike to $80.
During that bullish move, Williams %R likely reached the -10 to 0 zone, signaling exhaustion. The subsequent pullback to -46.95 indicates momentum has cooled without reaching oversold extremes that would suggest capitulation.
Momentum Implications
For bulls to regain control, Williams %R needs to stabilize around current levels and begin trending back toward -20 and above.
This would signal that buyers are returning and the consolidation is ending. A move back to the -10 to -20 range would confirm renewed momentum and likely coincide with price challenging the $80 highs.
For bears, a continued decline in Williams %R toward -60 and below would indicate the correction has more room to run. A drop to -70 or -80 would suggest a test of the 50 SMA at $56.65 or potentially deeper support levels.
The neutral reading creates an environment where the next catalyst could determine direction.
Key Support and Resistance Levels
Resistance levels to watch:
- Immediate resistance: $72-$75 (recent consolidation highs, upper dotted line)
- Major resistance: $78-$80 (December record high, psychological barrier)
- Breakout level: $85-$90 (would align with optimistic analyst targets)
Critical support levels:
- Immediate support: $68-$70 (20 SMA, current consolidation floor)
- Secondary support: $65-$67 (middle dotted line, prior resistance turned support)
- Strong support: $56-$58 (50 SMA, November breakout level)
- Major support: $53-$55 (200 SMA and lower dotted line, August-September consolidation)
- Extended support: $48-$50 (psychological level, deeper correction zone)
The $68-$72 Critical Zone
The convergence of the 20 SMA at $68 and the recent consolidation lows around $68-$70 creates the most important near-term support level.
This zone represents approximately 4% below the current price and marks the line in the sand for maintaining the bullish structure established by the December breakout.
A hold above this zone with a reversal pattern would validate the bull case and suggest Rocket Lab is merely consolidating gains before another leg higher.
But a decisive break below $68 on a closing basis would be the first technical warning that the pullback has more room to run. This would likely trigger algorithmic selling and target the $65 level initially, potentially followed by the 50 SMA at $56.65.
Resistance at $75-$80
The $72-$75 zone has acted as a ceiling during recent consolidation, with multiple attempts to reclaim higher ground meeting selling pressure.
This resistance represents where traders who bought the spike to $80 may be looking to exit positions near breakeven.
A convincing daily close above $75 with expanding volume would be the first signal that bulls are overcoming this supply and targeting a retest of the $80 highs. The psychological $80 level itself represents major resistance, as round numbers often do.
A breakout above $80 would likely trigger FOMO buying and renewed momentum, potentially targeting the $85-$90 zone where optimistic analyst price targets cluster.
Support at $56-$58
The 50 SMA at $56.65 represents the next major support level if the $68 zone fails. This area marked the November breakout level where Rocket Lab decisively broke above prior consolidation resistance. The 50 SMA has not been tested since that breakout, making this zone critical for maintaining the bull market structure.
A pullback to $56-$58 would constitute a roughly 20% decline from the highs, which would be considered healthy profit-taking after a 111% YTD gain.
Trading Outlook and Risk Assessment
Following its strong December rally, the stock is testing whether recent gains can be consolidated or whether momentum has been exhausted.
Risk-reward currently favors either waiting for successful support defense with confirmation or anticipating resistance rejection for short-term profit-taking plays.
Bullish Scenario
The bull case requires Rocket Lab to defend the $68-$72 support zone and generate enough momentum to reclaim the $75-$80 resistance area.
If this occurs with expanding volume, it would suggest the December catalysts have staying power, and the stock is building a base for another leg higher.
The fundamental backdrop strongly supports the bullish case.
The healthiest bullish scenario involves consolidation between $68-$75 that allows Williams %R to reset without significant price damage, followed by a volume breakout above $75.
This would target $80-$85 initially, with $90 as the extended objective.
Bulls could consider entries on pullbacks to $68-$70 with stops below $66, targeting $78-$80 for approximately 2:1 reward-to-risk.
Alternatively, waiting for a confirmed breakout above $75 with stops at $71 offers clearer directional confirmation.
Bearish/Correction Scenario
The bear case gains traction if Rocket Lab fails to hold the $68-$72 support zone, suggesting the rally move has exhausted itself, and deeper consolidation is needed.
If Rocket Lab breaks below $68 on a closing basis with expanding volume, bears could consider short positions.
Stops should be placed above $73 to limit risk if the breakout thesis proves incorrect.
Consolidation/Range-Bound Scenario
The most likely near-term outcome may be continued consolidation between $68-$75 as the market digests the December spike and awaits upcoming catalysts.
This would allow Williams %R to normalize and create a healthier technical base.
Key catalysts that could break the range:
- Neutron Updates: Any news on Q1 2026 arrival at Launch Complex 3 or first launch timing
- Q4 2025 Earnings (Late February 2026): First post-contract financial results with updated guidance
- Additional Contract Wins: SDA or other defense/commercial awards
- Launch Cadence: Maintaining 100% success rate and potentially accelerating launch frequency
- Analyst Target Updates: More firms revising to $85-$90 range would provide technical support
- Broader Space Sector Sentiment: SpaceX IPO speculation, policy developments
Until these catalysts arrive, you might consider range-bound strategies or remain patient for clearer directional signals.
Longer-Term Considerations
Despite near-term consolidation and the risk of profit-taking, Rocket Lab’s long-term growth narrative has strengthened significantly in recent months, driven by operational excellence and the expanding market of potential customers.
From Launch Provider to Integrated Space Systems Company
The $816M SDA contract represents a strategic milestone beyond just revenue.
It validates Rocket Lab’s vertical integration strategy and positions the company as a “one-stop shop” for space missions (launch + spacecraft + payloads).
This integrated capability differentiates Rocket Lab from pure-play launch providers.
Neutron: THE Catalyst
Neutron’s expected Q1 2026 arrival at Launch Complex 3 represents the single most important catalyst for the stock’s next phase.
The medium-lift reusable rocket (up to 13,000 kg payload) expands Rocket Lab’s addressable market dramatically:
- Constellation deployment (multiple satellites per launch).
- ISS cargo missions.
- Large satellite missions.
- Eventual crewed missions.
Any Neutron delays beyond Q1 2026 would likely trigger sharp stock reactions. But on-time delivery and a successful first launch could drive the stock toward $100+.
Operational Momentum
The acceleration from 10 Electron launches (2023) to 16 (2024) to 21 (2025) with a 100% success rate demonstrates scaling capability and operational excellence. Rocket Lab has moved missions up ahead of schedule, showcasing the agility that customers value.
As the world’s second most frequent private launch provider (behind only SpaceX), Rocket Lab has established itself as the clear #2 in a market experiencing explosive growth.
Technical Structure
From a long-term technical perspective, as long as Rocket Lab holds above the 200 SMA at $53.24, the primary uptrend structure remains intact.
This moving average represents the ultimate line of defense for bulls.
A break below $53 would be concerning and potentially target the $45-$48 zone from pre-breakout consolidation.
However, such a deep retracement seems unlikely absent major negative catalysts, given strengthened fundamentals.
Watch the $68-$72 support and $75-$80 resistance closely in coming sessions.
How Rocket Lab resolves this range will likely set the tone for early 2026 and determine whether the stock can build on December’s gains or needs deeper consolidation first.
- For long-term investors believing in the Neutron story and defense contract pipeline, pullbacks to the $65-$70 zone or even $56-$60 (50 SMA) would provide attractive entry points with better risk-reward than chasing near highs.
- For traders, the current setup favors waiting for either successful support defense with confirmation or a clear break of support for short-term positioning.
The December catalysts (SDA contract, launch record, Neutron progress) provide a strong fundamental foundation.
Whether that’s enough to overcome natural profit-taking after a 111% YTD gain will be determined in the coming weeks.