2025-12-31 00:57:00
Article Highlights
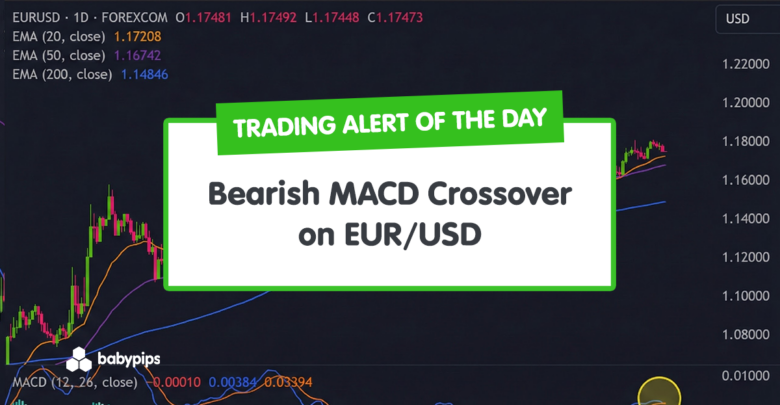
- MACD posts a fresh bearish crossover near recent highs, hinting that EUR/USD’s multi-week upside momentum is starting to fade.
- Price has pulled back from the 1.1800 area and is now drifting toward nearby support around 1.1700–1.1710.
- Momentum is turning lower beneath resistance, but the move may still prove to be a pause rather than a full trend reversal.
EUR/USD has produced a subtle but notable shift in momentum under the surface.
While price is only modestly lower, the MACD line has just rolled over against its signal line, hinting that the recent climb may be losing steam.
Traders watching the maturing up-move from November may want to pay closer attention to how this new downside momentum develops.
Welcome to “TA Alert of the Day.” Each day after the market close, MarketMilk scans for popular technical indicator alerts. We use these alerts as the basis for a mini-lesson, breaking down what each alert means, why it matters, and how traders might interpret it. The goal is to help beginner traders not only spot these alerts but also understand the logic behind them and how they can inform trading decisions.
What MarketMilk Has Detected
On market close today, MarketMilk has detected that the MACD (12, 26, 9) line has crossed below its signal line.
This indicates a fresh bearish crossover, suggesting that upside momentum has started to cool after EUR/USD’s steady climb from around 1.15–1.16 in November to the 1.17–1.18 area in late December.
Price is currently pulling back from last week’s highs near 1.1800, with the latest close at 1.174800 and a daily loss of -0.21%.
This shift occurs just beneath a short-term resistance zone around 1.1790–1.1805 (recent highs), while the nearest visible support sits around 1.1700–1.1710.
The development shows momentum turning down as price backs away from resistance, but has not yet tested key support.
What This Signals
Traditionally, a MACD line crossing below its signal line near recent swing highs can attract traders looking for an early warning of a potential momentum reversal.
In this case, the bearish crossover after a multi-week climb from roughly 1.15–1.16 to just under 1.18 suggests that the up-move may be tiring.
If the move is sustained and price begins to pressure support near 1.1700–1.1710, some traders may interpret this as the start of a deeper correction within or against the broader trend.
However, this same pattern can also represent a normal pause within an overall uptrend.
MACD crossovers near short-term consolidation zones sometimes coincide with minor pullbacks, where prices briefly drift lower or sideways before buyers regain control and push through recent resistance around 1.1790–1.1805.
In such cases, the bearish crossover becomes a temporary “breather” rather than a lasting top, especially if the price remains above key supports and quickly recovers.
The outcome depends heavily on subsequent price action around nearby support/resistance, the duration and depth of this momentum shift, and confirmation from higher timeframes.
How It Works
The MACD (Moving Average Convergence Divergence) compares two exponential moving averages (here, 12‑ and 26‑period EMAs) to measure trend momentum.
The MACD line is the difference between these EMAs, while the signal line is a 9‑period EMA of the MACD itself.
A bearish crossover occurs when the MACD line falls below the signal line, indicating that recent upside momentum is weakening relative to its recent average.
Important: MACD is a lagging indicator derived from moving averages, so crossovers often occur after the price has already made a move.
In choppy or range-bound conditions, like much of the 1.15–1.17 consolidation seen in November, MACD can produce multiple whipsaws.
Reliability tends to improve when the signal aligns with clear trend structure, major levels (such as 1.1700 support or 1.1800 resistance), and confirmation from other tools or higher timeframes.
What to Look For Before Acting
Do not assume a sustained bearish reversal is underway.
Consider these factors:
- Price action confirmation – Does EUR/USD break and close below the nearby support zone around 1.1700–1.1710, or does it quickly bounce back toward 1.1790–1.1805?
- Trend context – On the higher timeframe (such as the Weekly chart), is the broader structure still upward, sideways, or already rolling over?
- Momentum alignment – Do other momentum tools (like RSI or Stochastic) also show weakening upside momentum or emerging bearish divergence versus the recent highs near 1.1800?
- MACD histogram behavior – Does the histogram continue to grow more negative, indicating strengthening downside momentum, or does it flatten and turn back up quickly?
- Reaction at resistance – If price retests the 1.1790–1.1805 area, does it reject that zone with clear selling pressure, or break through and hold above it?
- Volatility conditions – Is volatility expanding (larger candles, wider ranges), which may support a more decisive move, or is price compressing into a tight range that can increase whipsaw risk?
- Fundamental backdrop – Are upcoming EUR or USD data releases (e.g., ECB/Fed communications, inflation, labor market data) likely to add directional momentum that could reinforce or negate this technical signal?
- Cross-asset and FX context – How are related pairs (e.g., USD/JPY, GBP/USD) and broader USD indices behaving—do they support a stronger USD narrative consistent with a bearish EUR/USD bias?
- Market risk sentiment – Is the environment risk-on (which can sometimes weaken USD) or risk-off (which can support USD as a haven), and does that align with the bearish MACD signal on EUR/USD?
Risk Considerations
⚠️ Whipsaw risk in a range. EUR/USD has spent much of the last 90 bars oscillating between roughly 1.15 and 1.18; MACD crossovers in such environments can reverse quickly, leading to false bearish signals.
⚠️ Counter-trend entry risk. If the broader daily trend remains upward, short positions taken solely on this crossover may be fighting the larger trend, especially if the price holds above 1.1700 support.
⚠️ Event-driven reversals. Sudden news or data surprises for the euro area or the U.S. can rapidly reverse short-term momentum, turning a valid-looking MACD crossover into a brief anomaly.
⚠️ Level misinterpretation. Assuming a breakdown before price actually clears and holds below key support (such as 1.1700) can lead to entries inside a still-intact consolidation.
Potential Next Steps
You may want to add EUR/USD on your watchlist and monitor how the price behaves around the 1.1700–1.1710 support band and the 1.1790–1.1805 resistance zone in the coming sessions.
Waiting for additional confirmation, such as follow-through selling, a clear break of support, or alignment with the higher‑timeframe trend, can help distinguish a meaningful shift in momentum from a short-lived pause.
Regardless of bias, position sizing, defined stop-loss levels, and awareness of upcoming EUR and USD news events remain important components of risk management around this type of MACD signal.