Chart Art: Amazon Consolidates Above Key Moving Averages. Ready for Breakout or Breakdown?
2025-12-30 14:20:00
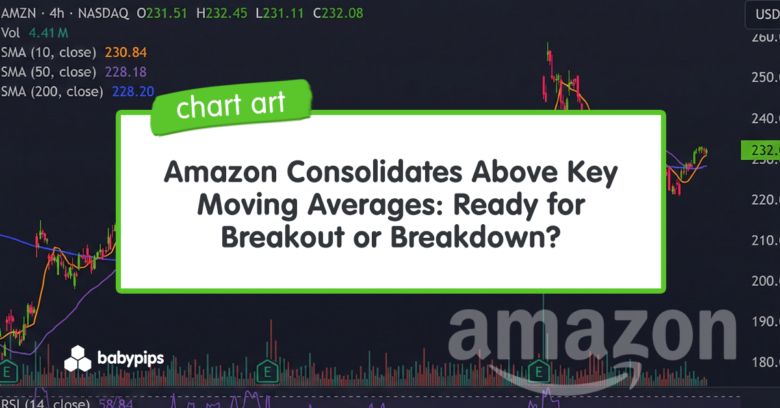
Amazon (AMZN) is trading around $232, consolidating above a critical cluster of moving averages after recovering from its November selloff, with the stock now testing whether it can resume its march toward the $240-$250 zone or succumb to another leg lower.
The e-commerce and cloud computing giant hit an all-time high of approximately $260 on November 3, 2025, following strong Q3 earnings, but then surrendered those gains in a sharp correction that took the stock down to $210.
After a 10% rally from those lows, Amazon now trades in a tight consolidation pattern with RSI at neutral 58.44, creating a technical setup that could resolve explosively in either direction.
So the question is:
Can Amazon break above the $235-$240 resistance zone and reclaim its November highs, or will the tight moving average cluster fail to hold, triggering another test of the $220 support level?
AMZN (Amazon): 4-Hour Chart
Trend and Market Structure
The 4-hour chart reveals a stock that experienced a powerful multi-month rally followed by a sharp correction, with Amazon now attempting to establish a higher low structure above critical moving average support.
Amazon’s 2025 journey has been characterized by volatility and underperformance relative to both the broader market and its Magnificent Seven peers.
While the stock is up approximately 5.6% year-to-date as of late December, this pales in comparison to the S&P 500’s double-digit gains and represents a disappointment for the company.
The chart displays a strong uptrend from May through October, with Amazon rallying from the low $200s to a peak of around $260 in early November.
This rally was driven by improving fundamentals and strong Q3 earnings results that exceeded expectations.
The Q3 Earnings Catalyst
Amazon’s October 30 earnings report served as the catalyst for the November highs. The company delivered:
- EPS: $1.95 vs $1.57 estimated (24% beat)
- Revenue: $180.17B vs $177.80B estimated
- AWS Revenue: $33B, up 20.2% YoY (fastest growth since 2022)
- Advertising Revenue: $17.7B, up 24% YoY
- AWS Backlog: $200B, providing multi-year revenue visibility
The strong results, particularly AWS reacceleration, drove the stock to its first record high since February 2025.
However, the rally proved unsustainable as broader market concerns about AI bubble valuations triggered a tech sector selloff in November.
The November Correction
From the November 3 peak near $260, Amazon experienced a sharp 19% correction down to approximately $210, marked by heavy volume selling indicated by the “E” markers on the chart.
This selloff reflected:
- Concerns about massive AI capital expenditure ($125B in 2025, increasing in 2026).
- Broader tech sector rotation as investors questioned AI valuations.
- Profit-taking after the post-earnings spike.
Moving Average Convergence: The Critical Setup
The most striking feature on this chart is the extremely tight convergence of the 50 and 200 SMAs. The 50 SMA sits at 228.18 while the 200 SMA is at 228.20, a difference of just 2 cents.
This confluence creates a powerful support zone that Amazon is currently trading above by approximately 1.7%.
Price currently sits just above the 10 SMA at $230.84, which has provided dynamic support during the recent recovery from $210.
The fact that all three major moving averages are clustered within a $4 range (228.18 to 232.08) indicates a period of equilibrium and compression that typically precedes a significant directional move.
This moving average convergence suggests Amazon is at an inflection point where the stock will either confirm a new uptrend by breaking decisively higher, or fail and potentially retest the recent lows.
The tight clustering also means that a break in either direction could trigger momentum-driven moves as the stock establishes a clear separation from the moving average cluster.
Recent Price Action
Since bottoming at $210, Amazon has recovered approximately 10% but has struggled to break convincingly above the $235 level.
The recent consolidation between roughly $228-$235 shows decreasing volatility, with candles becoming smaller and volume diminishing. This compression pattern often precedes breakouts, though the direction remains uncertain.
Momentum and RSI Analysis
The RSI indicator currently reads 58.44, sitting in neutral territory but leaning slightly bullish, reflecting the modest recovery from oversold conditions without yet signaling overbought extremes.
RSI Structure and Historical Context
An RSI reading of 58.44 places Amazon in a technically neutral zone, above the 50 midpoint but well below overbought territory at 70.
This reading suggests moderate positive momentum without the exhaustion signals that often precede reversals.
Examining the RSI’s path throughout 2025 reveals important patterns. During the May-October uptrend, the RSI oscillated between 50 and 70, occasionally spiking above 70 during strong rallies.
The indicator spent most of the uptrend in the 55-65 range, confirming healthy bullish momentum without extended overbought conditions.
The post-earnings spike to the November highs pushed RSI toward 80, reaching deeply overbought levels that signaled exhaustion. This extreme reading preceded the sharp November correction, as is typical when momentum indicators reach such extended levels.
During the November selloff, RSI plunged to approximately 30, reaching oversold territory and marking a potential capitulation point.
The subsequent bounce from $210 to current levels coincided with RSI recovering from 30 to the current 58.44, suggesting buying pressure has returned but hasn’t yet reached levels that would indicate excessive optimism.
Current RSI Implications
The current 58.44 reading creates an interesting technical setup. RSI above 50 technically confirms bullish momentum, but the reading isn’t strong enough to suggest a powerful uptrend is in place.
Instead, it indicates a market in transition, attempting to establish whether the recovery from $210 has legs or represents merely a bounce within a larger downtrend.
For bulls to gain confidence, RSI needs to push convincingly above 60 and maintain that level, ideally climbing toward 65-70.
This would suggest that buying momentum is accelerating, and the stock is transitioning from recovery mode to uptrend mode.
For bears, a failure of RSI to break above 60 followed by a rollover back toward 50 and below would indicate the recovery is losing steam.
A drop back toward the 40-45 zone would suggest sellers are regaining control and could precede a retest of the $220-$225 support area or potentially the $210 lows.
Momentum Divergence
Notably, the RSI is showing relatively healthy momentum considering the price is still well below the November highs.
While Amazon trades around $232 (approximately 11% below the $260 peak), RSI has recovered to 58.44. This suggests that the selling pressure has subsided and buyers are stepping in at lower levels, a mildly constructive sign.
However, for a true bullish breakout to occur, RSI would need to reach new highs as price challenges prior resistance levels.
Watch for confirmation or divergence as Amazon approaches the $240-$250 zone.
Key Support and Resistance Levels
Resistance levels to watch:
- Immediate resistance: $235-$238 (recent consolidation highs, multiple rejections)
- Secondary resistance: $240-$245 (prior support turned resistance from October)
- Major resistance: $250-$255 (psychological level, November breakdown point)
- All-time high: $260 (November 3, 2025 peak)
Critical support levels:
- Immediate support: $228-$230 (moving average cluster: 10/50/200 SMAs)
- Secondary support: $222-$225 (prior consolidation zone from recovery)
- Major support: $210-$215 (November low, critical line in the sand)
- Extended support: $200-$205 (psychological round number, deeper correction level)
The $228-$230 Moving Average Cluster: Make or Break
The convergence of the 10, 50, and 200 SMAs in the $228-$230 zone creates the most critical support level on the chart. This tight clustering represents several important technical factors:
- Dynamic Support: The 50/200 SMAs are essentially identical, while the 10 SMA hovers just above, creating a narrow band of support.
- Institutional Interest: The 200 SMA often marks where long-term investors see fair value.
- Trend Confirmation: Price above all moving averages confirms bullish structure.
- Compression Point: Tight clustering typically precedes volatility expansion.
A hold above this zone validates the bullish case and suggests Amazon is building a base for another leg higher. The tight stop-loss level ($228) makes this an attractive risk-reward setup for bulls.
However, a decisive break below the $228 moving average cluster would be a significant bearish development.
It would signal that the recovery has failed and likely trigger algorithmic sell orders and stop losses, potentially accelerating a move back toward the $210-$215 zone or lower.
Resistance at $235-$240
The $235-$238 area has acted as a brick wall during the recent consolidation, with multiple attempts to break higher meeting with selling pressure.
This resistance zone represents where sellers from higher levels (those trapped from the November peak) are eager to exit positions at better prices.
A convincing daily close above $238 with expanding volume would be the first signal that bulls are overcoming this supply. The next target would be $245, followed by the psychologically important $250 level.
The $250-$255 zone is particularly significant as it represents the area where the November breakdown began. Reclaiming this level would require strong fundamental catalysts and would signal that the correction has fully played out.
Support at $210-$215
The November low around $210-$215 represents the most critical support for the intermediate-term bullish case.
This level marked where buyers aggressively stepped in to halt the selloff, creating a potential higher low relative to earlier 2025 corrections.
A break below $210 would be a major concern, challenging the entire 2025 structure and potentially targeting the $190-$200 range, representing a 17-20% decline from current levels.
Trading Outlook and Risk Assessment
Amazon is stuck in a tight range, with prices capped above and supported below, and while it’s leaning higher, the move isn’t convincing yet.
Risk-reward currently favors either waiting for a successful moving average defense with confirmation or anticipating resistance rejection for short opportunities.
Bullish Scenario
The bull case requires Amazon to defend the $228-$230 moving average cluster and generate enough momentum to break above the $235-$238 resistance zone.
If this occurs with expanding volume and improving RSI, it would suggest the November correction has ended, and a new uptrend leg is beginning.
The healthiest bullish scenario would involve a successful defense of the $228-$230 cluster, followed by consolidation that allows RSI to build momentum, then a volume breakout above $238.
Targets would be $245-$250 initially, with $260 (prior highs) as the ultimate objective.
Bulls could consider entries on pullbacks to $228-$230 with stops below $226, targeting $240-$245 for approximately 2:1 reward-to-risk.
Alternatively, waiting for a confirmed breakout above $238 with stops at $232 offers clearer directional confirmation.
Bearish/Correction Scenario
The bear case gains traction if Amazon fails at the $235-$238 resistance and breaks below the $228-$230 moving average cluster.
This would suggest the recovery was merely a bounce within a larger corrective structure.
Technical warnings that support the bearish case:
- Year-to-date underperformance (only up 5.6% vs S&P 500’s double-digit gains)
- Failed breakout attempt at November highs
- Inability to reclaim $240 despite multiple attempts
- Decreasing volume during recovery suggests waning conviction
- Price is trading near the moving average support rather than the resistance
Fundamental headwinds include:
- Massive capital intensity ($125B in 2025, increasing in 2026) is pressuring near-term cash flow
- Competition from Microsoft (Azure up 33% YoY) and Google (Cloud up 32% YoY)
- Concerns about the AI spending bubble and return on investment timeline
- Regulatory scrutiny is continuing across multiple jurisdictions
- Consumer spending uncertainty heading into 2026
If Amazon breaks below $228 on a closing basis with expanding volume, bears could consider short positions.
Stops should be placed above $235 to limit risk if the breakout thesis proves incorrect.
Consolidation/Range-Bound Scenario
The most likely near-term outcome may be continued consolidation between $228-$238 as the market digests the recovery and awaits catalysts.
This would allow the tight moving average cluster to act as a foundation while Amazon builds energy for the next directional move.
Key catalysts that could break the range:
- Q4 2025 Earnings (Late January 2026): Guidance on AWS growth trajectory and AI monetization will be critical
- Holiday Season Sales Data: Performance of the retail segment and advertising revenue growth
- AWS re:Invent Follow-Through: Customer adoption of Trainium3 and Project Rainier
- Capital Expenditure Updates: Any changes to 2026 spending plans could impact sentiment
- Broader Market Direction: Tech sector performance and AI sentiment will influence Amazon
Until these catalysts arrive, traders might consider range-bound strategies or remain patient for clearer directional signals.
The compressed volatility and tight moving average clustering suggest the next move could be significant once direction is established.
Longer-Term Considerations
From a long-term technical perspective, as long as Amazon holds above the 200 SMA at $228.20, the primary uptrend structure remains intact.
This moving average has provided support multiple times throughout 2025 and represents the line in the sand for the bullish case.
A break below $228 would not necessarily invalidate the long-term bull thesis but would suggest a deeper correction is needed to work off the November excess.
Potential targets would be the $200 psychological level or even $190, representing the late summer consolidation zone.
Watch the $228-$230 support and $235-$238 resistance closely in the coming sessions.
How Amazon resolves this compressed range will likely set the tone for early 2026 and determine whether the stock can finally break out of its year-long consolidation and challenge the November highs.
- For long-term investors believing in AWS and AI infrastructure leadership, pullbacks to the $220-$228 zone would provide attractive entry points with better risk-reward than current levels.
- For traders, the compressed technical setup favors waiting for a clear directional break with confirmation before committing capital.
The convergence of moving averages, neutral RSI, and compressed price action all point to an imminent resolution.
Whether that resolution is bullish or bearish will depend on Amazon’s ability to defend the $228 cluster and generate enough momentum to overcome the $238 resistance that has capped multiple rally attempts.