2025-12-26 16:09:00
Article Highlights
- AMD trying to settle into a new trading range, holding above key support near 200 while still struggling to break through resistance around 220–225.
- Massive $165-$205 zone below acts as safety net. Break below $200 opens deeper correction.
- OpenAI and Oracle deals secured in Q4. Stock still down 20%+ from highs. Technical damage outweighs fundamental wins for now.
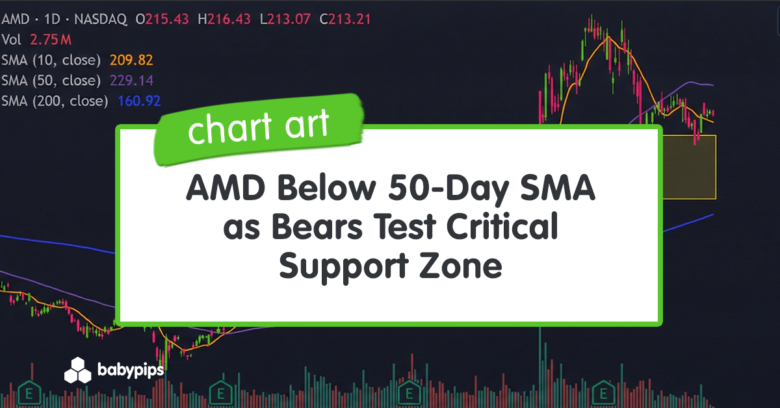
Advanced Micro Devices (AMD) is trading around $215, caught in a grinding correction that has erased nearly $60 from the November highs near $270, representing a decline of over 20%. Yikes.😬
The semiconductor giant, despite securing major AI partnerships with OpenAI and Oracle earlier in the quarter, now finds itself trapped below its 50-day moving average with weakening momentum and a pattern of lower highs that threatens further downside.
The massive support zone between $165-$205 looms below as the last line of defense.
But now the question is:
Can AMD defend the $210 support zone and stage a year-end recovery toward $230, or will the breakdown below the 50-day SMA accelerate into a deeper retest of the $200 level or even the support zone below?
AMD: Daily Chart
Trend and Structure
The daily chart reveals a stock that experienced a spectacular rally followed by a brutal pullback, with AMD now testing critical support levels that will determine the next major directional move.
AMD’s 2025 journey has been a tale of two distinct phases.
- The first phase saw a powerful rally from the early-year lows near $100 to September consolidation around $165, representing a 65% gain.
- The second phase accelerated dramatically in October and November, with AMD surging from the $165 breakout level to a peak near $270, an additional 63% move that brought year-to-date gains to over 170%.
This explosive autumn rally was driven by multiple fundamental catalysts.
- OpenAI Partnership (October 6, 2025): Multi-year AI chip supply deal for six gigawatts, with OpenAI receiving warrants to potentially acquire up to 10% stake in AMD
- Q3 Earnings Beat (November 4, 2025): EPS of $1.20 beat estimates of $1.16, revenue of $9.25 billion exceeded expectations of $8.75 billion, representing 36% year-over-year growth
- Analyst Day Targets (November 2025): Management unveiled $100 billion annual data center revenue goal and expansion plans for AI infrastructure, including MI400 chips and Helios rack system
- Oracle Partnership: Commitment to deploy 50,000 AMD MI450 processors beginning Q3 2026,
- Multiple Analyst Upgrades: Bank of America raised its target from $250 to $300, Jefferies set $300 target, citing expanded AI product pipeline and institutional demand
However, since peaking in November, AMD has entered a corrective phase characterized by a clear pattern of lower highs and lower lows.
This correction has taken AMD from above all moving averages to below the 50-day SMA, which now acts as overhead resistance.
The stock remains well above the 200-day SMA at $160.92, confirming that the longer-term bull market structure remains intact despite the intermediate-term correction.
The 10-day SMA at $209.82 sits just below the current price, providing immediate support.
Recent price action shows AMD attempting to stabilize in the $210-$215 range, but the inability to reclaim the 50-day SMA at $229 keeps the bearish intermediate-term trend intact.
Momentum and RSI Analysis
The RSI indicator currently reads 47.21, sitting just below the neutral 50 level and reflecting the weakening momentum that has characterized the correction phase since November.
An RSI reading below 50 technically confirms bearish momentum, though at 47.21 the indicator is close enough to neutral that a reversal remains possible.
The current reading suggests neither extreme bullish nor bearish pressure, creating an environment where the next catalyst could determine direction.
A move above 50 followed by a push toward 55-60 would represent the first sign that momentum is shifting back to the bulls and could signal that the correction is ending.
Conversely, a breakdown below 45 would indicate sellers are pressing their advantage and increase the probability of a test of the $200 level or the support zone below.
- For bulls to regain confidence, they need to see RSI reclaim the 50 level and maintain readings above it, ideally climbing back toward 60-65. This would confirm improving momentum and suggest buyers are returning.
- For bears, a failure to reclaim 50 combined with a drift toward 40 would validate the continuation of the correction.
The neutral RSI reading combined with price below the 50-day SMA creates a “show me” environment where the market is waiting for proof of directional commitment before making the next significant move.
Key Support and Resistance Levels
Resistance levels to watch:
- Immediate resistance: $215-$220 (recent consolidation highs and psychological level)
- Critical resistance: $229 (50-day SMA, key trend indicator)
- Secondary resistance: $235-$240 (December high and breakdown point)
- Major resistance: $250-$255 (would signal trend reversal)
- Strong resistance zone: $260-$270 (November highs, full recovery)
Critical support levels:
- Immediate support: $209-$212 (10-day SMA and current test level)
- First major support: $205-$208 (psychological level and zone boundary)
- Strong support zone: $195-$200 (round number and previous consolidation)
- Massive support zone: $165-$205 (yellow shaded area, breakaway gap)
- Long-term support: $160-$165 (200-day SMA area)
Monitor the 50-day SMA to determine AMD’s intermediate-term trend.
As long as the price remains below this moving average, the bearish correction structure remains in control. A reclaim of the 50-day SMA with conviction would be the first signal that bulls are attempting to regain control.
On the downside, the $209-$212 zone where the 10-day SMA resides is the immediate line in the sand. A break below this level would likely trigger a rapid test of the psychological $200 level.
The round number at $200 carries significant psychological weight and would be defended by both technical traders and longer-term investors looking for entry points.
The most important piece of art on this chart is the massive support zone spanning $165-$205 (highlighted in yellow).
A return to this area would likely attract substantial buying interest from investors who missed the October-November rally or institutional players looking to accumulate on weakness.
A breakdown below $200 would not necessarily invalidate the long-term bullish structure, but it would represent a deeper correction that tests the breakout level.
The 200-day SMA at $160.92 sits at the lower end of this support zone and would serve as the ultimate line of defense for the bull case. A break below $160 would be a major concern that would challenge the entire 2025 rally structure. 💀
Trading Outlook and Risk Assessment
AMD is currently testing support below the 50-day moving average with neutral momentum and facing the decision between stabilization or a deeper correction.
The current structure requires disciplined risk management and patience, as the correction could resolve in multiple ways.
Risk-reward favors waiting for either a successful support defense with reversal signals or a confirmed breakdown before committing capital.
Bullish Scenario
The bullish case requires AMD to defend the $209-$212 support zone and generate a reversal pattern that reclaims the 50-day SMA at $229. If this occurs, it would suggest the correction has found a floor, and buyers are returning.
A successful defense of current support would likely trigger short-covering and attract buyers who view the 20%+ decline as an overreaction to the November overbought conditions.
The fundamental backdrop remains supportive, with the OpenAI and Oracle partnerships providing multi-year revenue visibility and the November analyst day targets demonstrating management’s confidence in long-term growth.
The healthiest bullish scenario would involve a final spike down to test the $205-$208 zone, followed by a strong reversal candle with expanding volume.
This would flush out the remaining weak hands and create a springboard for the next leg higher. If this occurs with RSI bouncing from the 40-45 area back toward 55-60, it would confirm genuine buying interest.
A break above the 50-day SMA at $229 with RSI reclaiming 50 and pushing toward 60 would be the clear technical signal that bulls have seized control.
This would likely target $240-$250 initially and potentially a retest of the $260-$270 November highs if semiconductor sector strength continues and Q4 earnings meet expectations.
Even if AMD breaks below $210, bulls have a secondary defense at the massive $165-$205 support zone.
A move into the upper portion of this zone ($195-$205) could provide an attractive risk-reward entry for longer-term positions, especially if RSI reaches the 35-40 oversold area and generates positive divergence.
Bearish Scenario
The bearish case has gained traction as AMD remains below the 50-day SMA with RSI below 50 and a clear pattern of lower highs since November.
If AMD breaks below the $209-$212 support zone convincingly, it would validate the correction continuation scenario.
The technical deterioration is evident: price below the 50-day SMA, declining RSI, lower highs pattern, and failure to generate sustained bounces. If the $210 level fails with RSI breaking below 45, it would likely accelerate selling toward the $200 psychological level.
Bears looking for short opportunities should wait for a confirmed break below $209 on a daily closing basis, ideally with a breakdown candle and expanding volume.
The initial target would be $200-$205, with stops above $220. This represents a clear risk-defined short setup.
A break below $200 would be more significant and could trigger a deeper correction toward the $180-$190 range or even a full retest of the breakout zone at $165-$175.
The December selloff in technology stocks, concerns about AI valuation, and competitive pressures from companies like NVIDIA and emerging Chinese AI chip makers provide fundamental support for the bearish technical case.
Recent commentary stresses AMD’s execution risk in scaling its roadmap and the challenge of building a software ecosystem to rival Nvidia’s CUDA.
Longer-Term Considerations
Despite the intermediate-term correction, AMD’s longer-term technical structure remains constructive. The stock trades well above its 200-day SMA at $160.92, confirming that the primary uptrend that has characterized 2025 remains intact.
The massive support zone between $165-$205 represents an important area. If AMD returns to this zone, it would represent a test of the breakout level, which is a common occurrence after huge advances.
Such a test, if it holds, would actually strengthen the long-term bullish case by establishing a more solid foundation.
From a fundamental perspective, the partnerships announced in Q4 2025 provide multi-year revenue visibility.
The OpenAI deal for six gigawatts of chip supply and Oracle’s commitment to 50,000 MI450 processors represent billions of dollars in future revenue.
AMD’s November Financial Analyst Day target of $100 billion in annual data center revenue, while ambitious, reflects management’s confidence in capturing share in the exploding AI infrastructure market.
That said, AMD faces significant competitive challenges. NVIDIA maintains a dominant market share in AI accelerators, and its CUDA software ecosystem provides a substantial moat.
Also, China is heavily backing domestic GPU makers such as MetaX Integrated Circuits and Moore Threads as part of a broader push to reduce reliance on U.S. chipmakers like Nvidia and AMD.
This, together with U.S. export controls and Chinese restrictions on foreign AI chips in state‑funded data centers, is significantly constraining AMD’s ability to grow its data‑center GPU business in China.
The current price action suggests AMD is in the process of deciding between two scenarios:
- A healthy correction before another leg higher.
- Or a deeper retracement to retest the breakout zone.
A hold above $210 with improving RSI would favor the “healthy consolidation” narrative. A break below with continued momentum deterioration would favor the “deeper correction” scenario.
Watch the $210 and $229 levels with particular focus.
- The $210 support determines whether the current correction remains orderly or accelerates lower.
- The $229 resistance (50-day SMA) determines whether bulls can shift the intermediate-term trend back to positive.
For swing traders, the ideal approach is waiting for confirmation rather than trying to catch a falling knife.
Either a successful support defense with a reversal pattern (bullish entry) or a confirmed break below $209 (bearish/short entry) provides clearer risk-reward than trying to trade the current indecision zone.
How this correction resolves will determine AMD’s near-term price trajectory. The technical setup suggests a decisive move is coming soon, likely within the first few weeks of 2026.