2025-12-25 02:19:00
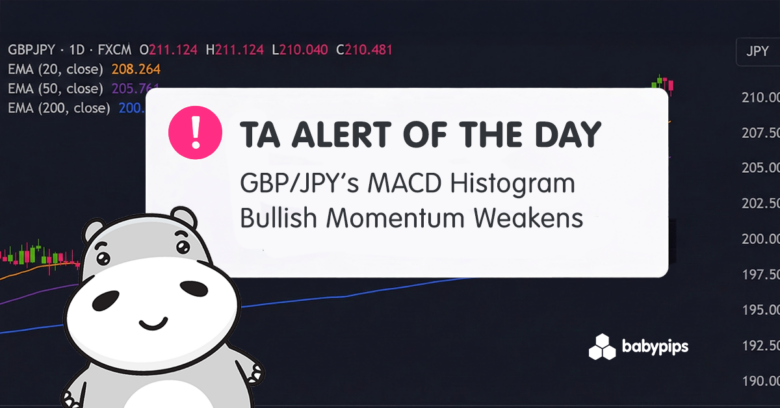
The latest MACD histogram reading on GBP/JPY shows early signs that the recent bullish momentum may be losing strength.
Price is still trading near multi-month highs, but the underlying momentum profile is no longer accelerating.
This kind of shift can precede a pause, consolidation, or a deeper corrective phase, making it a key moment for traders to reassess risk around current levels.
What MarketMilk Has Detected
MarketMilk has detected that the MACD(12,26,9) histogram remains in positive territory but is now falling from a recent peak, shifting from 0.194561 → 0.227695 → 0.180527.
This pattern indicates that while the uptrend is still intact, the rate of bullish momentum is weakening rather than strengthening.
Price has recently moved from the 205.00–207.00 zone in early December to highs above 211.00, and is now pulling back to 210.497.
GBP/JPY has transitioned from the 198–203 range (late September–October) into a persistent uptrend, with successive higher highs through 205.00, 207.00, and then the 211.00 area.
The current softening in the MACD histogram appears just after the price tagged fresh highs around 211.40–211.60, suggesting potential momentum exhaustion near this emerging resistance area.
What This Signals
Traditionally, a declining MACD histogram, while it is still positive, suggests that bullish momentum might be losing steam and can attract traders looking for a potential pullback or bearish reversal.
In strong uptrends like GBP/JPY has shown from late November onward, this pattern often marks a transition from aggressive trending behavior into either consolidation or a correction, especially when it appears near recent highs.
If this loss of momentum is sustained and accompanied by further price softness, it may indicate sellers gaining traction from the 211.00 resistance area.
However, this same pattern can also represent a normal “breather” within a healthy uptrend where prices briefly drift lower or sideways before buyers reassert control.
In a strong trend, MACD histogram peaks often roll over several times while price continues to grind higher, and short-lived momentum dips can become bear traps for aggressive early shorts.
If GBP/JPY stabilizes above nearby support zones such as 208.50–209.00 or prior breakout areas near 207.00 and then resumes higher, this current signal could end up being a minor pause rather than a meaningful top.
The outcome depends heavily on:
- How price behaves around recent resistance near 211.00 and nearby support levels.
- How the MACD line and signal line evolve from here.
- And whether higher timeframes (such as the weekly chart) confirm or contradict this emerging weakness in bullish momentum.
How It Works
The MACD (Moving Average Convergence Divergence) histogram measures the distance between the MACD line (difference between a 12-period and 26-period EMA) and its 9-period signal line.
- When the histogram is positive and rising, it indicates strengthening bullish momentum.
- But when it remains positive but starts to fall, it indicates that bullish momentum is still present but weakening.
The recent shift from 0.227695 down to 0.180527 while still above zero suggests that buying pressure is no longer accelerating despite the price being near recent highs.
Important: MACD and its histogram are momentum and trend-following tools, not timing tools on their own. Histogram rollovers can occur several times during a trend and do not always lead to immediate or large reversals. Signals tend to be more reliable when they align with key price levels (support/resistance), broader trend structure, and confirmation from higher timeframes and related indicators.
What to Look For Before Acting
Do not assume this MACD histogram weakness means GBP/JPY is about to reverse sharply lower.
Consider these factors:
- Price action confirmation – Does price start making lower highs and lower lows below the recent peak around 211.40–211.60, rather than just a shallow intraday dip?
- Reaction at nearby support – Watch how GBP/JPY behaves around the 209.00–209.50 area and deeper supports near 207.00; firm bounces here would weaken the bearish case.
- MACD line and signal behavior – Does the MACD line cross below its signal line, or does the histogram flatten and turn back up, signaling a re-acceleration of bullish momentum?
- Higher timeframe alignment – On the weekly chart, is momentum also slowing (smaller candles, wicks at the top, or weekly MACD/oscillator flattening), or does the larger trend still show strong upside continuation?
- Trend context – Given the strong climb from roughly 205.00 to above 211.00 in December, is this move extended relative to recent swings, or does it fit within a steady, controlled uptrend?
- Volatility conditions – Are daily ranges expanding sharply on the downside (suggesting more aggressive selling), or is the pullback occurring on contained volatility, implying routine profit-taking?
- Key GBP and JPY catalysts – Check for upcoming Bank of England or Bank of Japan communications, UK data (GDP, CPI, employment), and global risk headlines that could reinforce or negate this technical signal.
- Cross-asset and risk sentiment – If broader markets move into risk-off mode (supporting JPY strength), this MACD weakening may gain significance; in strong risk-on phases, GBP/JPY uptrends can persist despite momentum dips.
- Correlation with related pairs – Observe whether other JPY crosses (such as EUR/JPY, AUD/JPY) are also showing MACD momentum slowdowns or if GBP/JPY is diverging from other yen pairs.
Risk Considerations
⚠️ Whipsaw risk in strong trends. In robust uptrends, a weakening MACD histogram can signal only a brief pause, leading to false bearish entries if traders anticipate a deeper reversal too early.
⚠️ Lack of price confirmation. Relying solely on the histogram without observing lower highs/lows, breaks of support, or candlestick confirmation can result in trades taken against the prevailing trend.
⚠️ Timeframe mismatch. A short-term momentum slowdown can occur while the higher timeframe trend remains strongly bullish, causing countertrend positions to be squeezed as the dominant trend resumes.
⚠️ Event-driven reversals of technicals. Surprises in macro data, central bank communication, or sudden shifts in risk sentiment can quickly negate a developing momentum slowdown and re-ignite the prior trend.
⚠️ Over-reliance on a single indicator. MACD histogram signals are more robust when combined with other tools (support/resistance, candlesticks, RSI) rather than being used in isolation.
Near‑Term Macro Catalysts (Next Day)
The next 24 hours are relatively light on scheduled data for GBP but contain a key BoJ communication that could drive JPY volatility and, by extension, GBPJPY.
BoJ: On December 25, there is a scheduled speech by Governor Ueda at the Meeting of Councillors of Keidanren. The time is listed as “undecided” on the BoJ release calendar. Markets will watch for any guidance on the path after the recent hike to 0.75% and the potential timing of further moves.
Japan data: In the next session, the main data to watch are Japan’s releases of industrial production and retail sales. These reports, together with Ueda’s comments, may influence market views on the yen.
U.K.: December 25 is Christmas Day and an official U.K. bank holiday. No major GBP data or BoE events are scheduled. Liquidity in GBP crosses, including GBPJPY, is likely to be thin and moves more sensitively than usual to any BoJ‑related headlines or shifts in overall risk sentiment.
Potential Next Steps
You may consider adding GBP/JPY to a watchlist, focusing on how the price reacts around the 211.00 resistance area and nearby support levels between 209.00 and 207.00 as the MACD histogram cools.
Waiting for additional confirmation, such as a MACD line crossover, a clear lower high, or a break of key support, can help distinguish between a routine pause and a more meaningful momentum shift.
Any trading plan built around this signal should incorporate disciplined risk management, including predefined stop-loss levels, position sizing appropriate to volatility, and awareness of upcoming GBP and JPY-related news that could amplify or invalidate the current technical setup.