2025-12-18 18:05:00
The global metals market is witnessing a significant divergence as structural demand fuels a bullish outlook for gold and copper, while cyclical headwinds pressure industrial materials. Goldman Sachs has doubled down on its “long gold” conviction, projecting a double-digit rally by 2026.
-
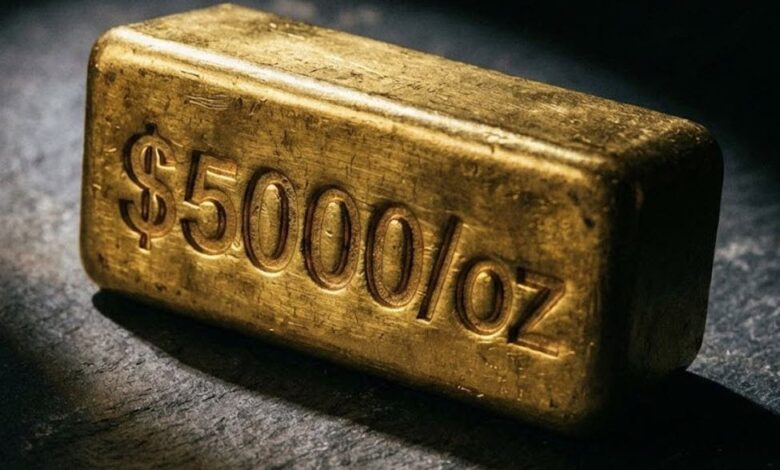
Gold’s $4,900 Target: Goldman Sachs has identified a 14% upside risk for gold, forecasting prices to hit $4,900/oz by December 2026, driven by central bank demand and its role as a strategic reserve.
-
Copper vs. Aluminum: The bank maintains a $15,000/ton target for copper by 2035, recommending a “long copper / short aluminum” pair trade to capitalize on the widening supply-demand gap.
-
Bearish Pressure: Aluminum and iron ore are facing a “full oversupply cycle,” with aluminum expected to drop nearly 20% by the end of 2026 as global surpluses expand.
Gold Technicals: Defending the 100-Hour Moving Average
Following Goldman’s optimistic report, gold price action has remained remarkably resilient. After reaching a daily high of $4,375.17—falling just short of the October all-time high of $4,381.84—the price faced a minor corrective rotation.
Crucially, the intraday dip found aggressive buyers near the 100-hour moving average (the blue line on your chart). Despite briefly slipping below this level to a low of $4,308.81, the price failed to stay down. The quick recovery above the $4,319 moving average confirms that bullish bias remains intact.
The Path to $5,000: Targets and Risk Levels
To validate Goldman Sachs’ 12.8% projected run for 2026, the technical “roadmap” must align with the fundamental narrative. Here is what to watch:
The Bullish Objective
For the uptrend to accelerate, buyers need to:
-
Establish a firm base above the 100-hour moving average ($4,319).
-
Clear the October all-time high of $4,381.84. A sustained break above this level is the “green light” for a move toward psychological milestones at $4,500 and eventually the $4,900–$5,000 zone.
The Bearish Risk
If the sellers are to gain a foothold, they must:
-
Force a decisive close below the 100-hour MA.
-
Push the price toward the 200-hour moving average (currently at $4,268.85). Only a break below the “green line” would signal a shift in control from the buyers to the sellers in the short term.
Structural vs. Cyclical: The Metals Divide
Goldman’s outlook highlights a clear “quality” preference in commodities. While Gold and Copper are viewed as structural necessities for central bank reserves and AI/Green energy infrastructure, Aluminum and Iron Ore are suffering from weakening Chinese demand and rising global supply. This makes technical levels in gold even more vital, as the “buy the dip” mentality is supported by long-term institutional positioning.
Watch the Video Analysis
In the video above, Greg Michalowski, author of Attacking Currency Trends, provides a real-time breakdown of the gold charts. He explores the Goldman Sachs targets, identifies the specific hourly moving averages to define your risk, and outlines the next upside targets that would keep the buyers in control at least in the short term.