2025-12-18 15:59:00
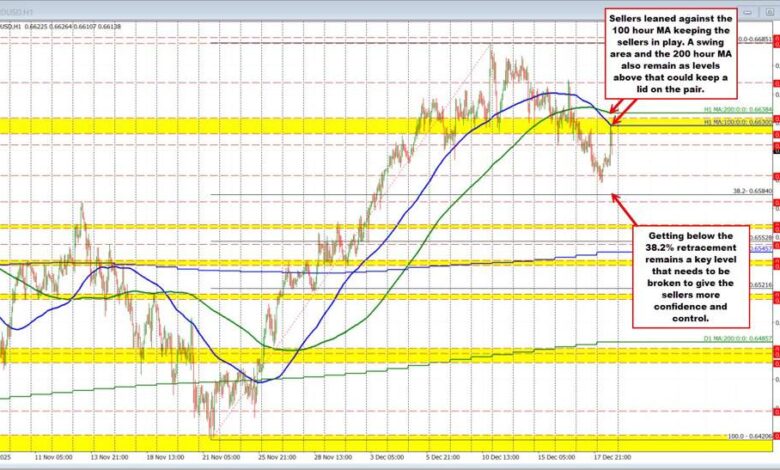
The AUDUSD has reached a critical technical crossroads. After a strong rally from the mid-November lows, the “Aussie” is now facing its first major test of structural support. Sellers have officially wrestled back short-term control, but a key Fibonacci floor stands in their way.
-
Shift in Power: For the first time since mid-November, sellers have pushed the price below the 100 and 200-hour moving averages, ending a period where bulls were firmly “in control.”
-
The Resistance Ceiling: A major swing area between 0.66247 and 0.6635 (dating back to July) has flipped from support to resistance, capping today’s post-CPI bounce.
-
The Downside Target: The ultimate “line in the sand” for buyers is the 38.2% retracement at 0.6584. Failure to hold this level could open the trap door for a much deeper correction.
Sellers Break the “Bull Run” Momentum
Since the mid-November low of 0.6420, the AUDUSD enjoyed a nearly uninterrupted climb to last week’s peak of 0.66851. However, that momentum hit a brick wall yesterday.
The pair decisively moved below both the 100-hour moving average (blue line) and the 200-hour moving average (green line). More importantly, it fell beneath a historical swing zone between 0.66247 and 0.6635. This area has been a vital technical pivot since July; by trading below it, the short-term bias has shifted from “buy the dips” to “sell the rallies.”
US CPI Data and the Failed Recovery
In today’s trading, the Asian-Pacific session saw an extension of this bearish momentum, with prices dropping to 0.6592. While US CPI data initially sent the US Dollar lower and sparked a relief rally in the Aussie, the bounce was short-lived.
As the price extended back into the 0.66247–0.6635 swing area, it ran directly into the falling 100-hour moving average. Buyers immediately turned into sellers at this level, confirming that the technical “ceiling” is holding firm.
The Battle Lines: 0.6584 vs. 0.6638
The market is currently trapped in a tactical battle. Here is how to define your risk for the next move:
-
The Bearish View: Sellers remain in charge as long as the price stays below the 100-hour moving average and the 0.6635 swing level. Their immediate goal is a break through the 38.2% retracement at 0.6584. If they clear that hurdle, the correction is likely to accelerate.
-
The Bullish View: Buyers are leaning on the fact that the 38.2% retracement has yet to be touched. To reclaim dominance, they must push the price back above the 200-hour moving average (0.6638). Staying above this “green line” would negate the recent breakdown and signal that the uptrend is ready to resume.
Watch the Video Analysis
In the video above, Greg Michalowski, author ofAttacking Currency Trends, provides a deep dive into these AUDUSD technical levels. He breaks down the real-time price action, helps you define your risk at these moving averages, and outlines the specific targets that will matter most for the remainder of the trading week.
Be aware. Be prepared.
Would you like me to create a quick “cheat sheet” table of these support and resistance levels for your records?