2025-12-18 15:25:00
The USDCAD pair is currently locked in a high-stakes technical tug-of-war. After a persistent decline from the late November highs, the price is wedged between two defining trend indicators, creating a “make-or-break” moment for short-term traders.
-
The Battleground: Price is squeezed between the 100-hour MA (1.3769) and the 200-hour MA (1.3795), signaling a shift from a trending market to a consolidative one.
-
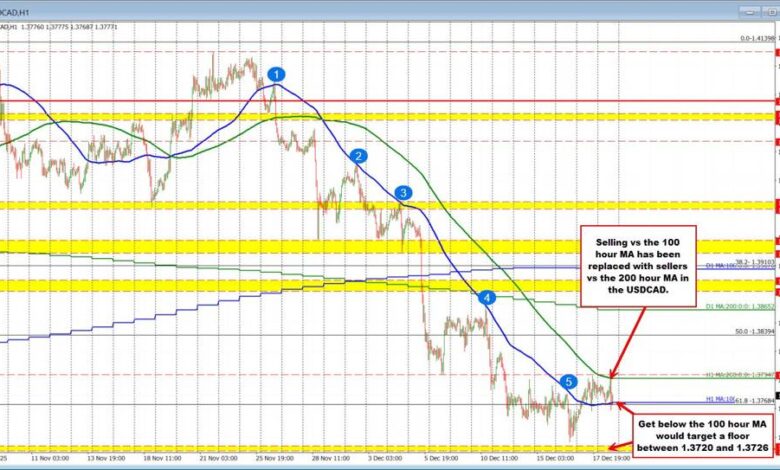
Key Support: The 1.3720–1.3726 zone remains a “line in the sand” for sellers, having held firm as a triple-bottom floor since August.
-
What’s Next: A sustained break above 1.3800 opens the door for a recovery, while a move below the 100-hour MA shifts the bias back to the bears.
Understanding the 100-Hour Moving Average Resistance
Since the end of November, the 100-hour moving average (the blue line on your chart) has acted as a formidable ceiling for the USDCAD. From November 26 until very recently, every corrective bounce was met with aggressive selling whenever it approached this level. In fact, price tested this average on five separate occasions, and each time, the sellers successfully defended the downtrend.
This type of “stair-step” lower confirms that the institutional bias was firmly bearish, using the 100-hour MA as a primary risk-defining level for short positions.
The Tide Turns: Tuesday’s Bottom and the Breakout
The narrative began to shift on Tuesday. The pair found a significant floor between 1.3720 and 1.3726. This isn’t just a random number; this area represents a structural support zone going back to August and September, where three distinct bottoms were formed.
When the price dipped to 1.3729 (just 3 pips shy of the high of that zone) and bounced, it signaled that the “value buyers” were stepping back in. This momentum was strong enough to finally push the USDCAD above the 100-hour moving average yesterday—a feat the bulls hadn’t accomplished in weeks.
The Current Standoff: 100 MA vs. 200 MA
While the break above the 100-hour MA was a victory for the bulls, the celebration was short-lived. The higher 200-hour moving average (the green line) stands at 1.3795, acting as the new ceiling. Yesterday, momentum faded just before reaching that target.
Today, we are seeing a classic “retest of support.” The price rotated lower but found a floor exactly at the 100-hour moving average. It then bounced back toward the 200-hour MA, where sellers are currently “leaning” against the level to prevent a full-scale reversal.
Strategic Outlook: Bullish vs. Bearish Scenarios
The market is currently in a state of equilibrium, but the breakout from this 26-pip range (1.3769 to 1.3795) will likely dictate the next major move.
The Bullish Case
To confirm a shift in control, buyers must:
-
Maintain the price above the 100-hour MA (blue line on chart below at 1.3769) on any dips.
-
Force a daily close above the 200-hour MA (green line on the chart below at 1.3795).
-
Clear the psychological 1.3800 resistance area to invite new momentum buyers.
The Bearish Case
To regain the dominant downtrend, sellers must:
-
Push the price back below the 100-hour MA.
-
Hold the price below that level to trap the “late” buyers.
-
Target a retest of the 1.3720–1.3726 floor. A break below this multi-month support would open the door for a significant extension of the downside
Watch the Video Analysis
In the video above, Greg Michalowski, author of Attacking Currency Trends, provides a deep dive into these technical levels. He breaks down the real-time price action, helps you define your risk at these moving averages, and outlines the specific targets that will matter most for the remainder of the trading week.
Be aware. Be prepared.