2025-12-17 15:12:00
Key Technical Takeaways
-
Bearish Shift: The AUDUSD is undergoing a downside correction as sellers gain short-term market control.
-
Critical Zone Breached: Price has fallen back below the historically significant 0.66247–0.6635 swing area on the 4-hour chart.
-
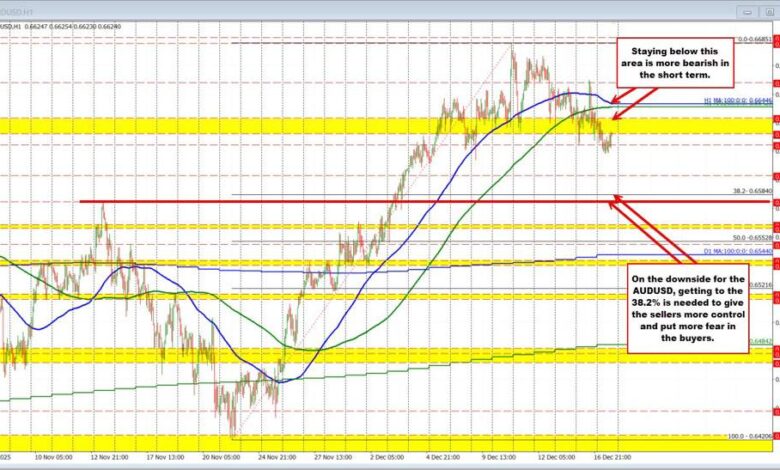
Hourly Resistance Stacked: The 100 and 200-hour moving averages near 0.6644 are now acting as a dynamic ceiling for price action.
-
The Line in the Sand: Bears need a sustained break below the 38.2% Fibonacci support cluster at 0.6580–0.6584 to accelerate the downside momentum.
The AUDUSD pair is currently facing renewed selling pressure, executing a downside correction that suggests a shift in near-term sentiment. After recent bullish attempts, the technical landscape indicates that sellers are trying to wrestle back control from buyers—at least for the short-term horizon.
This shift is evidenced by price action breaking below several key technical hurdles that had previously supported the pair.
The 4-Hour Chart View: Breaking Historical Support Zones
A broader look at the 4-hour chart reveals a significant development: the price has slid back below a critical swing area defined between 0.66247 and 0.6635.
This is not a new technical level; this swing area has deep historical relevance, going back to mid-July. Throughout the period from July to early October, this zone acted frequently as both a stubborn ceiling and a supportive floor.
In the last few weeks, this area was revisited, resulting in messy, chopping up-and-down trading as the market struggled to find a clear direction around it. However, today’s decisive move back below this level is significant. It signals that the previous support has failed, tilting the immediate technical bias firmly to the downside.
Hourly Chart Analysis: Moving Averages Turn Resistance
Drilling down to the tighter hourly chart timeframe confirms the bearish shift. The price has also dropped below major moving averages, adding confluence to the resistance overhead.
Specifically, the price is now trading below both the 100-hour and 200-hour moving averages. Currently, these moving averages are clustered just above that aforementioned swing area, near the 0.6644 level.
When price falls below these key averages, their role often flips from providing dynamic support to acting as dynamic resistance. The clustering of the historical swing zone (0.6635) and these moving averages (0.6644) creates a formidable barrier for any immediate bullish recovery attempts.
Short-Term Trading Scenarios: Defining Risk
For traders looking at this market, the technical breaks provide clear levels against which to define risk.
Those looking to lean into this corrective move lower could utilize the swing area ceiling up to 0.6635 as primary resistance. Alternatively, more conservative traders might look to the 100 and 200-hour moving averages near 0.6644 as the ultimate “line in the sand” for a bearish trade setup. As long as the price remains below these levels, the path of least resistance remains down.
The Path Ahead: Critical Support Targets
While the sellers have won the opening battle of this correction, they still have significant work to do on the downside to truly make the longer-term buyers anxious and fearful.
The next major test for the bears is the 38.2% Fibonacci retracement of the significant move up from the November low to the December high. This retracement level currently comes in at 0.6584. Further strengthening this support zone is a previous swing high going back to November 13, located at 0.6580.
This 0.6580–0.6584 cluster is critical support. For the bearish bias to increase significantly and for the correction to turn into a broader trend reversal, this level must be broken decisively. Until then, buyers may still view dips as opportunities near major Fibonacci support.